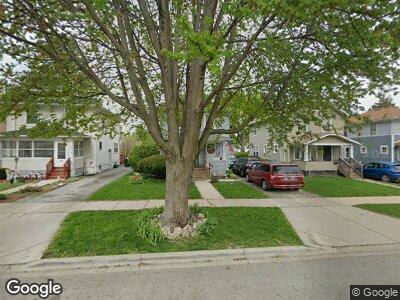
823 Talma St Aurora, IL 60505
Southeast Aurora NeighborhoodEstimated Value: $224,261 - $255,000
3
Beds
1
Bath
1,232
Sq Ft
$199/Sq Ft
Est. Value
About This Home
This home is located at 823 Talma St, Aurora, IL 60505 and is currently estimated at $245,315, approximately $199 per square foot. 823 Talma St is a home located in Kane County with nearby schools including Dieterich Elementary School, K D Waldo Middle School, and East Aurora High School.
Ownership History
Date
Name
Owned For
Owner Type
Purchase Details
Closed on
Aug 24, 2005
Sold by
Humiston Allan K
Bought by
Weber Kathleen and Weber Tim
Current Estimated Value
Home Financials for this Owner
Home Financials are based on the most recent Mortgage that was taken out on this home.
Original Mortgage
$119,000
Outstanding Balance
$72,756
Interest Rate
7.1%
Mortgage Type
Purchase Money Mortgage
Purchase Details
Closed on
Oct 2, 2003
Sold by
Humiston Allan K
Bought by
Humiston Allan K and Allan K Humiston Trust Agreement
Purchase Details
Closed on
May 25, 2000
Sold by
Humiston Allan and Humiston Alice
Bought by
Weber Kathleen and Weber Tim
Home Financials for this Owner
Home Financials are based on the most recent Mortgage that was taken out on this home.
Original Mortgage
$45,000
Interest Rate
9.52%
Mortgage Type
Unknown
Create a Home Valuation Report for This Property
The Home Valuation Report is an in-depth analysis detailing your home's value as well as a comparison with similar homes in the area
Home Values in the Area
Average Home Value in this Area
Purchase History
| Date | Buyer | Sale Price | Title Company |
|---|---|---|---|
| Weber Kathleen | -- | Commercial Land Title | |
| Humiston Allan K | -- | -- | |
| Weber Kathleen | -- | -- |
Source: Public Records
Mortgage History
| Date | Status | Borrower | Loan Amount |
|---|---|---|---|
| Open | Weber Kathleen | $119,000 | |
| Previous Owner | Weber Tim | $75,000 | |
| Previous Owner | Weber Tim | $45,000 | |
| Previous Owner | Weber Kathleen | $45,000 |
Source: Public Records
Tax History Compared to Growth
Tax History
| Year | Tax Paid | Tax Assessment Tax Assessment Total Assessment is a certain percentage of the fair market value that is determined by local assessors to be the total taxable value of land and additions on the property. | Land | Improvement |
|---|---|---|---|---|
| 2023 | $3,099 | $49,471 | $4,715 | $44,756 |
| 2022 | $2,974 | $45,138 | $4,302 | $40,836 |
| 2021 | $2,908 | $42,024 | $4,005 | $38,019 |
| 2020 | $2,747 | $39,034 | $3,720 | $35,314 |
| 2019 | $2,658 | $36,166 | $3,447 | $32,719 |
| 2018 | $2,660 | $35,213 | $3,188 | $32,025 |
| 2017 | $2,297 | $29,418 | $2,937 | $26,481 |
| 2016 | $2,857 | $27,154 | $2,518 | $24,636 |
| 2015 | -- | $26,617 | $2,165 | $24,452 |
| 2014 | -- | $24,635 | $1,990 | $22,645 |
| 2013 | -- | $26,042 | $2,002 | $24,040 |
Source: Public Records
Map
Nearby Homes
- 633 Watson St
- 1028 5th St
- 831 S Union St
- 454 Weston Ave
- 735 Sexton St
- Lot 1 Douglas Ave
- 450 Center Ave
- 307 Bevier Place
- 555 North Ave
- 555 S Lasalle St
- 400 S Lasalle St
- 438 North Ave
- 135 Evans Ave
- 312 S Spencer St
- 1228 Lebanon St
- 1210 Douglas Ave
- 168 S 4th St
- 1203 S State St
- 1368 Talma St
- 418 E Benton St