Estimated Value: $812,000 - $940,170
3
Beds
3
Baths
2,464
Sq Ft
$358/Sq Ft
Est. Value
About This Home
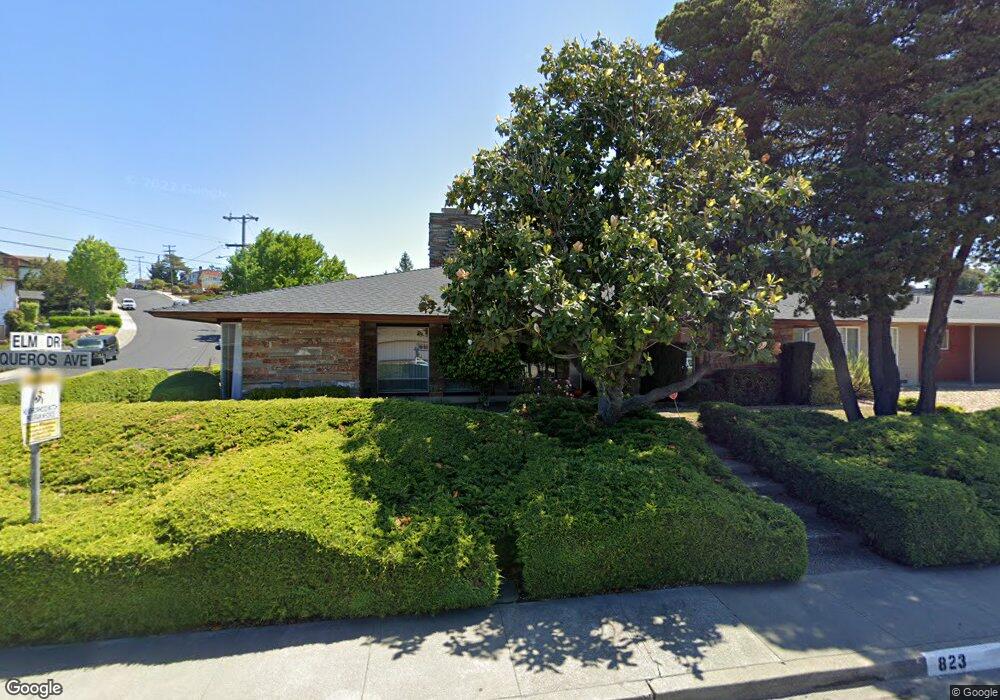
This home is located at 823 Vaqueros Ave, Rodeo, CA 94572 and is currently estimated at $882,043, approximately $357 per square foot. 823 Vaqueros Ave is a home located in Contra Costa County with nearby schools including Rodeo Hills Elementary School, Carquinez Middle School, and John Swett High School.
Ownership History
Date
Name
Owned For
Owner Type
Purchase Details
Closed on
Jun 15, 2021
Sold by
Pierson Ted R and Pierson David T
Bought by
Pierson David T and Pierson Tammy Lynn
Current Estimated Value
Purchase Details
Closed on
Aug 3, 2017
Sold by
Pierson Ted R
Bought by
Pierson Ted R and Pierson David T
Purchase Details
Closed on
Nov 14, 2016
Sold by
Pierson Ted R
Bought by
Pierson Ted R
Home Financials for this Owner
Home Financials are based on the most recent Mortgage that was taken out on this home.
Original Mortgage
$234,336
Interest Rate
3.42%
Mortgage Type
New Conventional
Purchase Details
Closed on
Dec 24, 2013
Sold by
Pierson Marian
Bought by
Marian Pierson Revocable Living Trust
Create a Home Valuation Report for This Property
The Home Valuation Report is an in-depth analysis detailing your home's value as well as a comparison with similar homes in the area
Home Values in the Area
Average Home Value in this Area
Purchase History
| Date | Buyer | Sale Price | Title Company |
|---|---|---|---|
| Pierson David T | -- | Old Republic Title | |
| Pierson Ted R | -- | None Available | |
| Pierson Ted R | -- | None Available | |
| Pierson Ted R | -- | Old Republic Title Company | |
| Pierson Ted R | -- | Old Republic Title Company | |
| Marian Pierson Revocable Living Trust | -- | None Available |
Source: Public Records
Mortgage History
| Date | Status | Borrower | Loan Amount |
|---|---|---|---|
| Closed | Pierson Ted R | $234,336 |
Source: Public Records
Tax History
| Year | Tax Paid | Tax Assessment Tax Assessment Total Assessment is a certain percentage of the fair market value that is determined by local assessors to be the total taxable value of land and additions on the property. | Land | Improvement |
|---|---|---|---|---|
| 2025 | $12,169 | $930,890 | $432,972 | $497,918 |
| 2024 | $11,934 | $912,638 | $424,483 | $488,155 |
| 2023 | $11,934 | $894,744 | $416,160 | $478,584 |
| 2022 | $11,893 | $877,200 | $408,000 | $469,200 |
| 2021 | $3,386 | $158,121 | $22,380 | $135,741 |
| 2019 | $3,306 | $153,433 | $21,717 | $131,716 |
| 2018 | $3,232 | $150,426 | $21,292 | $129,134 |
| 2017 | $3,175 | $147,477 | $20,875 | $126,602 |
| 2016 | $2,909 | $144,586 | $20,466 | $124,120 |
| 2015 | $2,810 | $142,415 | $20,159 | $122,256 |
| 2014 | $2,757 | $139,627 | $19,765 | $119,862 |
Source: Public Records
Map
Nearby Homes
- 836 Hawthorne Dr
- 900 Seascape Cir
- 11 Fallen Leaf Ct
- 834 Coral Ridge Cir
- 1101 Chelsea
- 797 Coral Ridge Cir
- 1012 Salt Spray Terrace
- 801 Dover
- 802 Dover
- 704 Windsor Unit 704
- 120 Bonita Ct
- 106 White Cap Cove
- 405 Weymouth
- 1334 7th St
- 176 Bedford
- 938 Sandy Cove Dr
- 343 Rodeo Ave
- 922 Coral Dr
- 511 Third St
- 338 Garretson Ave
- 829 Vaqueros Ave
- 807 Elm Dr
- 835 Vaqueros Ave
- 813 Vaqueros Ave
- 813 Elm Dr
- 824 Vaqueros Ave
- 818 Vaqueros Ave
- 806 Elm Dr
- 830 Vaqueros Ave
- 810 Hawthorne Dr
- 812 Vaqueros Ave
- 807 Vaqueros Ave
- 819 Elm Dr
- 812 Elm Dr
- 790 Hawthorne Dr
- 806 Vaqueros Ave
- 826 Hawthorne Dr
- 801 Hawthorne Dr
- 801 Spruce Ct
- 807 Spruce Ct
Your Personal Tour Guide
Ask me questions while you tour the home.