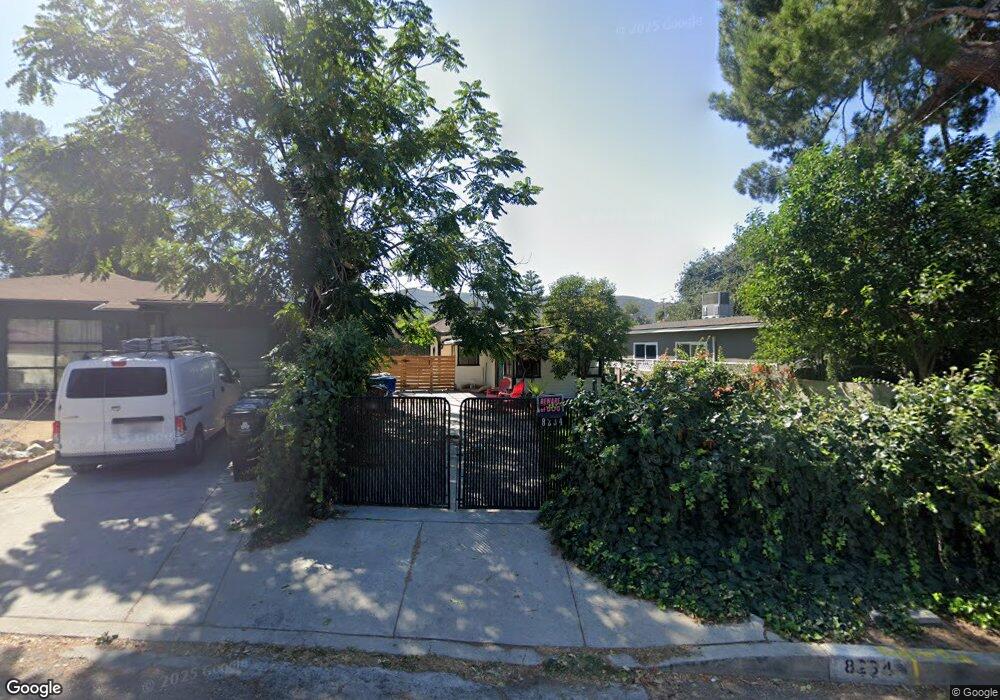
8234 Fenwick St Sunland, CA 91040
Sunland NeighborhoodEstimated Value: $527,000 - $663,000
2
Beds
1
Bath
680
Sq Ft
$884/Sq Ft
Est. Value
About This Home
This home is located at 8234 Fenwick St, Sunland, CA 91040 and is currently estimated at $601,230, approximately $884 per square foot. 8234 Fenwick St is a home located in Los Angeles County with nearby schools including Sunland Elementary School, Mt. Gleason Middle School, and Verdugo Hills Senior High School.
Ownership History
Date
Name
Owned For
Owner Type
Purchase Details
Closed on
Apr 8, 2008
Sold by
Fanning Christa and Fanning Christina
Bought by
Nelson Patrick R
Current Estimated Value
Home Financials for this Owner
Home Financials are based on the most recent Mortgage that was taken out on this home.
Original Mortgage
$196,910
Outstanding Balance
$123,690
Interest Rate
5.81%
Mortgage Type
FHA
Estimated Equity
$477,540
Purchase Details
Closed on
Mar 21, 2008
Sold by
Chehadah Eddie
Bought by
Fanning Christina
Home Financials for this Owner
Home Financials are based on the most recent Mortgage that was taken out on this home.
Original Mortgage
$196,910
Outstanding Balance
$123,690
Interest Rate
5.81%
Mortgage Type
FHA
Estimated Equity
$477,540
Create a Home Valuation Report for This Property
The Home Valuation Report is an in-depth analysis detailing your home's value as well as a comparison with similar homes in the area
Home Values in the Area
Average Home Value in this Area
Purchase History
| Date | Buyer | Sale Price | Title Company |
|---|---|---|---|
| Nelson Patrick R | $200,000 | Fidelity National Title | |
| Fanning Christina | -- | Fidelity National Title |
Source: Public Records
Mortgage History
| Date | Status | Borrower | Loan Amount |
|---|---|---|---|
| Open | Nelson Patrick R | $196,910 |
Source: Public Records
Tax History Compared to Growth
Tax History
| Year | Tax Paid | Tax Assessment Tax Assessment Total Assessment is a certain percentage of the fair market value that is determined by local assessors to be the total taxable value of land and additions on the property. | Land | Improvement |
|---|---|---|---|---|
| 2025 | $3,163 | $262,685 | $210,153 | $52,532 |
| 2024 | $3,163 | $257,535 | $206,033 | $51,502 |
| 2023 | $3,101 | $252,487 | $201,994 | $50,493 |
| 2022 | $2,956 | $247,537 | $198,034 | $49,503 |
| 2021 | $2,917 | $242,684 | $194,151 | $48,533 |
| 2019 | $2,828 | $235,489 | $188,394 | $47,095 |
| 2018 | $2,783 | $230,872 | $184,700 | $46,172 |
| 2016 | $2,652 | $221,909 | $177,529 | $44,380 |
| 2015 | $2,613 | $218,577 | $174,863 | $43,714 |
| 2014 | $2,628 | $214,296 | $171,438 | $42,858 |
Source: Public Records
Map
Nearby Homes
- 8230 Hillrose St
- 8421 Grenoble St
- 10704 Oro Vista Ave
- 10429 Mcvine Ave
- 10430 Mcvine Ave
- 10415 Mcvine Ave Unit 2
- 8352 Wyngate St
- 10335 Oro Vista Ave
- 10623 Woodward Ave
- 10250 Quill Ave
- 10711 Sherman Grove Ave Unit 26
- 10711 Sherman Grove Ave Unit 13
- 10711 Sherman Grove Ave Unit 36
- 10227 Quill Ave
- 10855 Woodward Ave
- 10799 Sherman Grove Ave
- 10799 Sherman Grove Ave Unit 18
- 10799 Sherman Grove Ave Unit 61
- 8545 Forsythe St
- 7851 Fenwick St
- 8238 Fenwick St
- 8230 Fenwick St
- 8242 Fenwick St
- 8226 Fenwick St
- 8233 Grenoble St
- 8229 Grenoble St
- 8246 Fenwick St
- 8235 Grenoble St
- 8231 Fenwick St
- 8239 Grenoble St
- 8235 Fenwick St
- 8223 Grenoble St
- 8227 Fenwick St
- 8250 Fenwick St
- 8239 Fenwick St
- 8214 Fenwick St
- 8223 Fenwick St
- 8219 Grenoble St
- 8243 Fenwick St
- 8254 Fenwick St