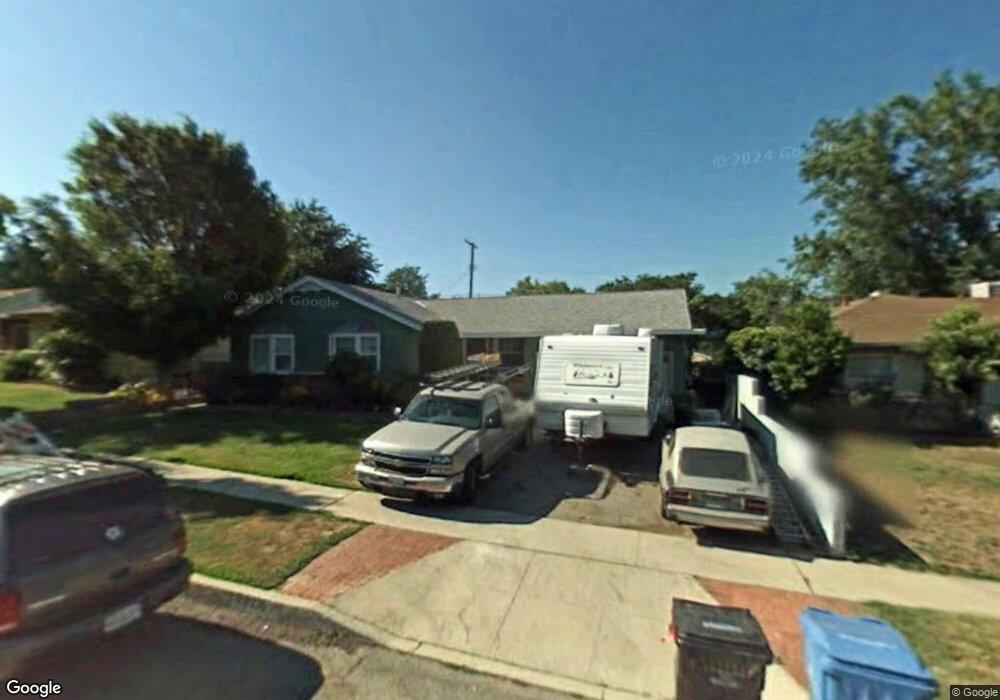
8236 Kyle St Sunland, CA 91040
Sunland NeighborhoodEstimated Value: $908,091 - $1,058,000
4
Beds
2
Baths
1,842
Sq Ft
$529/Sq Ft
Est. Value
About This Home
This home is located at 8236 Kyle St, Sunland, CA 91040 and is currently estimated at $975,023, approximately $529 per square foot. 8236 Kyle St is a home located in Los Angeles County with nearby schools including Sunland Elementary School, Mt. Gleason Middle School, and Verdugo Hills Senior High School.
Ownership History
Date
Name
Owned For
Owner Type
Purchase Details
Closed on
Mar 10, 1998
Sold by
Linnert George H & Lois C Family Trust
Bought by
Mcglamery John B and Mcglamery Sandra A
Current Estimated Value
Home Financials for this Owner
Home Financials are based on the most recent Mortgage that was taken out on this home.
Original Mortgage
$131,750
Interest Rate
7.06%
Purchase Details
Closed on
May 3, 1997
Sold by
Linnert George H
Bought by
Linnert Lois C and The George & Lois Linnert Family Trust
Create a Home Valuation Report for This Property
The Home Valuation Report is an in-depth analysis detailing your home's value as well as a comparison with similar homes in the area
Home Values in the Area
Average Home Value in this Area
Purchase History
| Date | Buyer | Sale Price | Title Company |
|---|---|---|---|
| Mcglamery John B | $175,000 | Southland Title Corporation | |
| Linnert Lois C | -- | -- |
Source: Public Records
Mortgage History
| Date | Status | Borrower | Loan Amount |
|---|---|---|---|
| Previous Owner | Mcglamery John B | $131,750 |
Source: Public Records
Tax History
| Year | Tax Paid | Tax Assessment Tax Assessment Total Assessment is a certain percentage of the fair market value that is determined by local assessors to be the total taxable value of land and additions on the property. | Land | Improvement |
|---|---|---|---|---|
| 2025 | $3,759 | $292,184 | $137,945 | $154,239 |
| 2024 | $3,759 | $286,456 | $135,241 | $151,215 |
| 2023 | $3,691 | $280,840 | $132,590 | $148,250 |
| 2022 | $3,525 | $275,335 | $129,991 | $145,344 |
| 2021 | $3,475 | $269,938 | $127,443 | $142,495 |
| 2019 | $3,375 | $261,933 | $123,664 | $138,269 |
| 2018 | $3,265 | $256,798 | $121,240 | $135,558 |
| 2016 | $3,104 | $246,828 | $116,533 | $130,295 |
| 2015 | $3,060 | $243,121 | $114,783 | $128,338 |
| 2014 | $3,079 | $238,360 | $112,535 | $125,825 |
Source: Public Records
Map
Nearby Homes
- 8230 Kyle St
- 10704 Oro Vista Ave
- 8347 Grenoble St Unit 9
- 8323 Grenoble St Unit 32
- 8226 Fenwick St
- 11020 Scoville Ave
- 8110 Brownstone St
- 8444 Grenoble St
- 10711 Sherman Grove Ave Unit 36
- 10549 Rhodesia Ave
- 12159 Oro Vista Ave
- 7932 Jayseel St
- 10799 Sherman Grove Ave Unit 18
- 10799 Sherman Grove Ave Unit 61
- 10799 Sherman Grove Ave
- 8545 Tujunga Valley St
- 10409 Parr Ave
- 8100 Foothill Blvd Unit 1
- 8100 Foothill Blvd Unit 3
- 8633 Le Berthon St
Your Personal Tour Guide
Ask me questions while you tour the home.