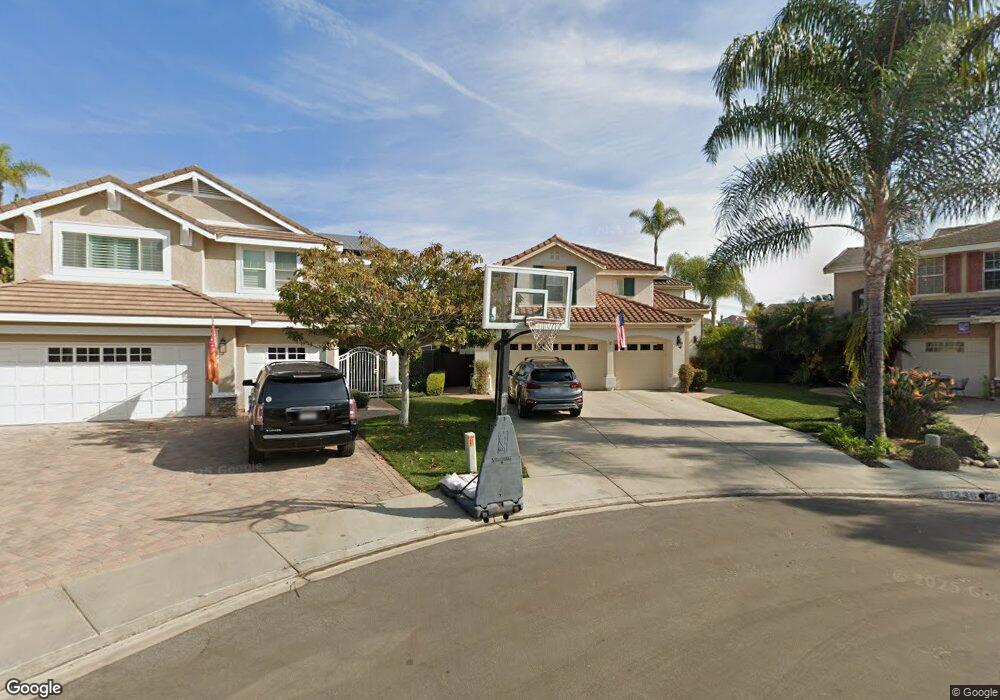
8238 Thimble Ct San Diego, CA 92129
Rancho Peñasquitos NeighborhoodEstimated Value: $1,952,000 - $2,269,622
5
Beds
4
Baths
3,384
Sq Ft
$612/Sq Ft
Est. Value
About This Home
This home is located at 8238 Thimble Ct, San Diego, CA 92129 and is currently estimated at $2,070,906, approximately $611 per square foot. 8238 Thimble Ct is a home located in San Diego County with nearby schools including Park Village Elementary School, Mesa Verde Middle School, and Westview High School.
Ownership History
Date
Name
Owned For
Owner Type
Purchase Details
Closed on
Feb 16, 2007
Sold by
Heinz Richard M and Heinz Pamela A
Bought by
Heinz Richard M and Heinz Pamela A
Current Estimated Value
Home Financials for this Owner
Home Financials are based on the most recent Mortgage that was taken out on this home.
Original Mortgage
$400,000
Outstanding Balance
$240,248
Interest Rate
6.21%
Mortgage Type
Stand Alone Refi Refinance Of Original Loan
Estimated Equity
$1,830,658
Purchase Details
Closed on
Jan 27, 1995
Sold by
Heinz Richard M and Heinz Pamela A
Bought by
Heinz Richard M and Heinz Pamela A
Purchase Details
Closed on
Nov 3, 1993
Sold by
Greystone Homes Inc
Bought by
Heinz Richard M and Heinz Pamela A
Home Financials for this Owner
Home Financials are based on the most recent Mortgage that was taken out on this home.
Original Mortgage
$227,600
Interest Rate
6.89%
Create a Home Valuation Report for This Property
The Home Valuation Report is an in-depth analysis detailing your home's value as well as a comparison with similar homes in the area
Home Values in the Area
Average Home Value in this Area
Purchase History
| Date | Buyer | Sale Price | Title Company |
|---|---|---|---|
| Heinz Richard M | -- | Southland Title Of San Diego | |
| Heinz Richard M | -- | Southland Title Of San Diego | |
| Heinz Richard M | -- | -- | |
| Heinz Richard M | $285,000 | Continental Lawyers Title Co |
Source: Public Records
Mortgage History
| Date | Status | Borrower | Loan Amount |
|---|---|---|---|
| Open | Heinz Richard M | $400,000 | |
| Closed | Heinz Richard M | $227,600 |
Source: Public Records
Tax History Compared to Growth
Tax History
| Year | Tax Paid | Tax Assessment Tax Assessment Total Assessment is a certain percentage of the fair market value that is determined by local assessors to be the total taxable value of land and additions on the property. | Land | Improvement |
|---|---|---|---|---|
| 2025 | $7,033 | $676,772 | $118,965 | $557,807 |
| 2024 | $7,033 | $663,503 | $116,633 | $546,870 |
| 2023 | $6,875 | $650,495 | $114,347 | $536,148 |
| 2022 | $6,777 | $637,741 | $112,105 | $525,636 |
| 2021 | $6,657 | $625,237 | $109,907 | $515,330 |
| 2020 | $6,583 | $618,827 | $108,781 | $510,046 |
| 2019 | $6,442 | $606,695 | $106,649 | $500,046 |
| 2018 | $7,224 | $594,800 | $104,558 | $490,242 |
| 2017 | $7,039 | $583,138 | $102,508 | $480,630 |
| 2016 | $6,944 | $571,705 | $100,499 | $471,206 |
| 2015 | $6,843 | $563,119 | $98,990 | $464,129 |
| 2014 | $6,810 | $552,089 | $97,051 | $455,038 |
Source: Public Records
Map
Nearby Homes
- 12485 Picrus St
- 12465 Pathos Ln
- 12518 Darkwood Rd
- 8695 Rideabout Ln
- 12537 Ginger Snap Ct
- 8672 Creekwood Ln
- 12660 Stella Ln
- 9012 Buckwheat St
- 12348 Dormouse Rd
- 9068 Buckwheat St
- 11598 Alkaid Dr
- 8754 Park Run Rd
- 12740 Prairie Dog Ave
- 12880 War Horse St
- 8761 Menkar Rd
- 8141 Calle Nueva
- 8419 Menkar Rd
- 8667 Cetus Rd
- 11416 Osoyoos Place
- 13146 Thunderhead St
- 8230 Thimble Ct
- 8248 Thimble Ct
- 8228 Thimble Ct
- 8245 Thimble Ct
- 8218 Thimble Ct
- 8275 Lino Ct
- 8241 Thimble Ct
- 8277 Lino Ct
- 8235 Thimble Ct
- 8225 Thimble Ct
- 8210 Thimble Ct
- 8265 Lino Ct
- 8272 Lino Ct
- 8219 Thimble Ct
- 8238 Cichlid Way
- 8230 Cichlid Way
- 8202 Thimble Ct
- 8215 Thimble Ct
- 8228 Cichlid Way
- 8218 Cichlid Way