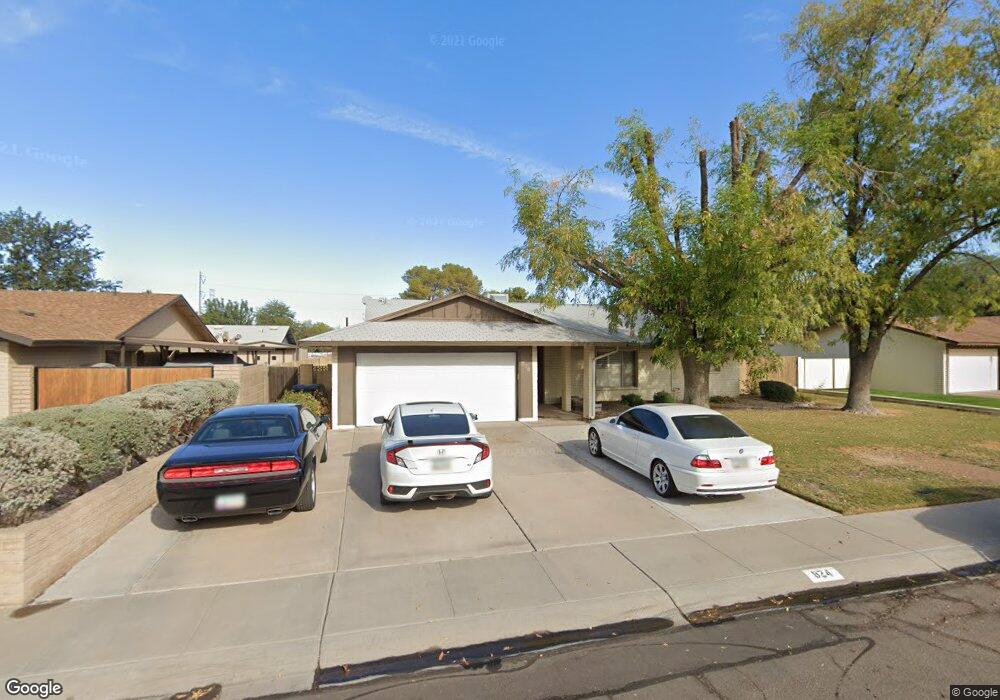
824 E Stephens Dr Tempe, AZ 85283
South Tempe NeighborhoodEstimated Value: $506,641 - $549,000
3
Beds
2
Baths
1,818
Sq Ft
$289/Sq Ft
Est. Value
About This Home
This home is located at 824 E Stephens Dr, Tempe, AZ 85283 and is currently estimated at $525,160, approximately $288 per square foot. 824 E Stephens Dr is a home located in Maricopa County with nearby schools including Kyrene del Norte School, Kyrene de los Niños Elementary School, and Kyrene Middle School.
Ownership History
Date
Name
Owned For
Owner Type
Purchase Details
Closed on
Jan 2, 2024
Sold by
Bucy Thor Mikel
Bought by
Odyssey Investments & Operations Group Llc
Current Estimated Value
Purchase Details
Closed on
Dec 27, 2006
Sold by
Moderacki Gloria J
Bought by
Bucy Thor M
Home Financials for this Owner
Home Financials are based on the most recent Mortgage that was taken out on this home.
Original Mortgage
$242,400
Interest Rate
6.16%
Mortgage Type
New Conventional
Purchase Details
Closed on
Jul 13, 2004
Sold by
Brigman Steve and Brigman Aileen
Bought by
Moderacki Gloria J
Home Financials for this Owner
Home Financials are based on the most recent Mortgage that was taken out on this home.
Original Mortgage
$143,900
Interest Rate
3.12%
Mortgage Type
New Conventional
Create a Home Valuation Report for This Property
The Home Valuation Report is an in-depth analysis detailing your home's value as well as a comparison with similar homes in the area
Home Values in the Area
Average Home Value in this Area
Purchase History
| Date | Buyer | Sale Price | Title Company |
|---|---|---|---|
| Odyssey Investments & Operations Group Llc | $490,000 | First American Title Insurance | |
| Odyssey Investments & Operations Group Llc | $490,000 | First American Title Insurance | |
| Bucy Thor M | $303,000 | Magnus Title Agency | |
| Moderacki Gloria J | $179,900 | Grand Canyon Title Agency In |
Source: Public Records
Mortgage History
| Date | Status | Borrower | Loan Amount |
|---|---|---|---|
| Previous Owner | Bucy Thor M | $242,400 | |
| Previous Owner | Moderacki Gloria J | $143,900 |
Source: Public Records
Tax History
| Year | Tax Paid | Tax Assessment Tax Assessment Total Assessment is a certain percentage of the fair market value that is determined by local assessors to be the total taxable value of land and additions on the property. | Land | Improvement |
|---|---|---|---|---|
| 2025 | $2,501 | $22,936 | -- | -- |
| 2024 | $2,365 | $21,843 | -- | -- |
| 2023 | $2,365 | $38,270 | $7,650 | $30,620 |
| 2022 | $2,255 | $28,700 | $5,740 | $22,960 |
| 2021 | $2,306 | $26,030 | $5,200 | $20,830 |
| 2020 | $2,255 | $24,250 | $4,850 | $19,400 |
| 2019 | $2,188 | $23,060 | $4,610 | $18,450 |
| 2018 | $2,121 | $21,430 | $4,280 | $17,150 |
| 2017 | $2,040 | $20,110 | $4,020 | $16,090 |
| 2016 | $2,058 | $18,870 | $3,770 | $15,100 |
| 2015 | $1,898 | $17,080 | $3,410 | $13,670 |
Source: Public Records
Map
Nearby Homes
- 831 E Divot Dr
- 920 E Mcnair Dr
- 6801 S Palm Dr
- 6833 S Jentilly Ln
- 987 E Divot Dr
- 758 E Sunburst Ln
- 1011 E Redfield Rd
- 7681 S Bonarden Ln
- 563 E Krista Way
- 1033 E Bendix Dr
- 1032 E Redfield Rd
- 1070 E Sunburst Ln
- 7720 S La Corta Dr
- 1045 E Sunburst Ln
- 7716 S Rita Ln Unit 3
- 738 E Strahan Dr
- 1060 E Louis Way Unit 14
- 6556 S La Rosa Dr
- 1125 E Lodge Dr
- 6743 S Newberry Rd
- 830 E Stephens Dr
- 818 E Stephens Dr
- 827 E Dava Dr
- 833 E Dava Dr
- 821 E Dava Dr
- 825 E Stephens Dr
- 812 E Stephens Dr
- 819 E Stephens Dr
- 831 E Stephens Dr
- 815 E Dava Dr
- 836 E Stephens Dr
- 839 E Dava Dr
- 813 E Stephens Dr
- 806 E Stephens Dr
- 838 E Stephens Dr
- 837 E Stephens Dr
- 826 E Dava Dr
- 809 E Dava Dr
- 826 E Todd Dr
- 822 E Todd Dr
Your Personal Tour Guide
Ask me questions while you tour the home.