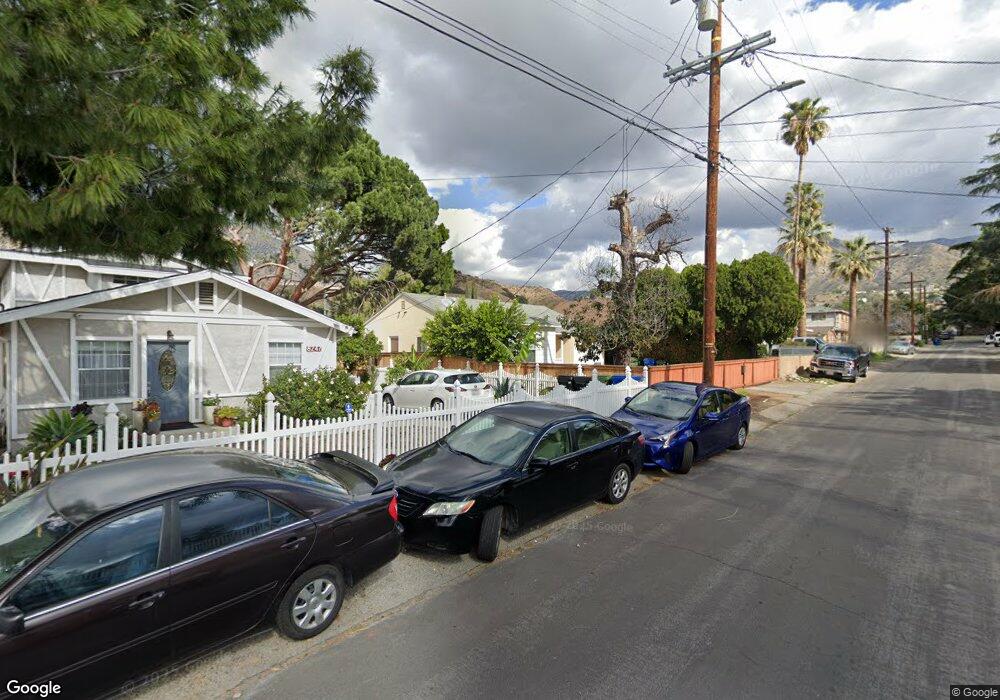
8241 Grove St Sunland, CA 91040
Sunland NeighborhoodEstimated Value: $719,713 - $817,000
2
Beds
1
Bath
980
Sq Ft
$788/Sq Ft
Est. Value
About This Home
This home is located at 8241 Grove St, Sunland, CA 91040 and is currently estimated at $772,428, approximately $788 per square foot. 8241 Grove St is a home located in Los Angeles County with nearby schools including Sunland Elementary School, Mt. Gleason Middle School, and Verdugo Hills Senior High School.
Ownership History
Date
Name
Owned For
Owner Type
Purchase Details
Closed on
Jul 31, 2000
Sold by
Ledon Victor
Bought by
Mailov Aydyn and Mailova Rena
Current Estimated Value
Home Financials for this Owner
Home Financials are based on the most recent Mortgage that was taken out on this home.
Original Mortgage
$160,000
Outstanding Balance
$57,727
Interest Rate
8.15%
Mortgage Type
Stand Alone First
Estimated Equity
$714,701
Purchase Details
Closed on
Jul 10, 1997
Sold by
Bank Of New York
Bought by
Ledon Victor and Ledon Virginia
Home Financials for this Owner
Home Financials are based on the most recent Mortgage that was taken out on this home.
Original Mortgage
$106,953
Interest Rate
7.45%
Mortgage Type
FHA
Purchase Details
Closed on
Jun 3, 1997
Sold by
Howe Sherrie L
Bought by
Bank Of New York and Nomura Asset Capital Corp
Home Financials for this Owner
Home Financials are based on the most recent Mortgage that was taken out on this home.
Original Mortgage
$106,953
Interest Rate
7.45%
Mortgage Type
FHA
Create a Home Valuation Report for This Property
The Home Valuation Report is an in-depth analysis detailing your home's value as well as a comparison with similar homes in the area
Home Values in the Area
Average Home Value in this Area
Purchase History
| Date | Buyer | Sale Price | Title Company |
|---|---|---|---|
| Mailov Aydyn | $160,000 | Fidelity Title | |
| Ledon Victor | $107,500 | Fidelity National Title Co | |
| Bank Of New York | $99,587 | American Title Co |
Source: Public Records
Mortgage History
| Date | Status | Borrower | Loan Amount |
|---|---|---|---|
| Open | Mailov Aydyn | $160,000 | |
| Previous Owner | Ledon Victor | $106,953 | |
| Closed | Mailov Aydyn | $24,000 |
Source: Public Records
Tax History Compared to Growth
Tax History
| Year | Tax Paid | Tax Assessment Tax Assessment Total Assessment is a certain percentage of the fair market value that is determined by local assessors to be the total taxable value of land and additions on the property. | Land | Improvement |
|---|---|---|---|---|
| 2025 | $3,026 | $241,069 | $177,194 | $63,875 |
| 2024 | $3,026 | $236,343 | $173,720 | $62,623 |
| 2023 | $2,970 | $231,710 | $170,314 | $61,396 |
| 2022 | $2,833 | $227,168 | $166,975 | $60,193 |
| 2021 | $2,795 | $222,714 | $163,701 | $59,013 |
| 2019 | $2,631 | $216,110 | $158,847 | $57,263 |
| 2018 | $2,585 | $211,874 | $155,733 | $56,141 |
| 2016 | $2,460 | $203,649 | $149,687 | $53,962 |
| 2015 | $2,424 | $200,591 | $147,439 | $53,152 |
| 2014 | $2,439 | $196,662 | $144,551 | $52,111 |
Source: Public Records
Map
Nearby Homes
- 11034 Scoville Ave
- 11009 Quill Ave
- 8110 Brownstone St
- 8545 Forsythe St
- 10704 Oro Vista Ave
- 0 Rim Canyon Rd Unit SR25228396
- 8230 Hillrose St
- 7844 Rim Canyon Rd
- 10799 Sherman Grove Ave
- 10799 Sherman Grove Ave Unit 18
- 10799 Sherman Grove Ave Unit 61
- 7848 Forsythe St
- 10711 Sherman Grove Ave Unit 26
- 10711 Sherman Grove Ave Unit 13
- 10711 Sherman Grove Ave Unit 36
- 7815 Denivelle Rd
- 10623 Woodward Ave
- 8720 Mulberry Dr
- 8421 Grenoble St
- 7755 Forsythe St