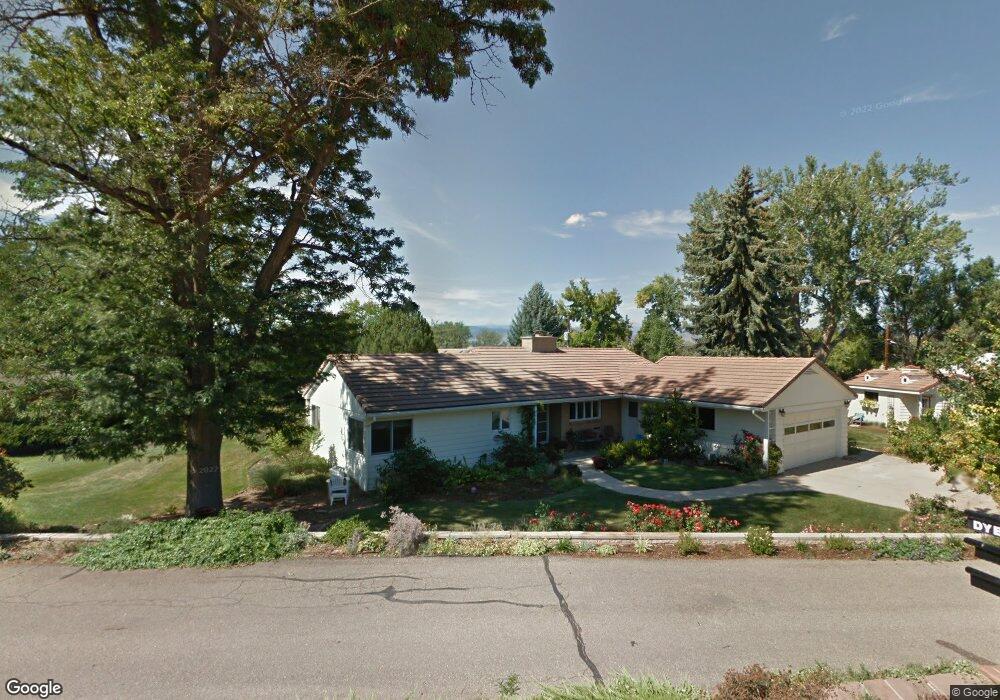
825 Dickens Ct Longmont, CO 80501
Sunset NeighborhoodEstimated Value: $656,455 - $789,000
4
Beds
3
Baths
2,004
Sq Ft
$366/Sq Ft
Est. Value
About This Home
This home is located at 825 Dickens Ct, Longmont, CO 80501 and is currently estimated at $733,614, approximately $366 per square foot. 825 Dickens Ct is a home located in Boulder County with nearby schools including Central Elementary School, Westview Middle School, and Longmont High School.
Ownership History
Date
Name
Owned For
Owner Type
Purchase Details
Closed on
Mar 8, 2005
Sold by
Winship Leslie J
Bought by
Dreyer Leslie W and Dreyer Donald P
Current Estimated Value
Purchase Details
Closed on
Feb 26, 1987
Bought by
Dreyer Leslie W and Dreyer Donald P
Purchase Details
Closed on
Apr 19, 1983
Bought by
Dreyer Leslie W and Dreyer Donald P
Purchase Details
Closed on
Sep 18, 1975
Bought by
Dreyer Leslie W and Dreyer Donald P
Create a Home Valuation Report for This Property
The Home Valuation Report is an in-depth analysis detailing your home's value as well as a comparison with similar homes in the area
Home Values in the Area
Average Home Value in this Area
Purchase History
| Date | Buyer | Sale Price | Title Company |
|---|---|---|---|
| Dreyer Leslie W | -- | -- | |
| Dreyer Leslie W | $137,000 | -- | |
| Dreyer Leslie W | $119,800 | -- | |
| Dreyer Leslie W | -- | -- |
Source: Public Records
Tax History Compared to Growth
Tax History
| Year | Tax Paid | Tax Assessment Tax Assessment Total Assessment is a certain percentage of the fair market value that is determined by local assessors to be the total taxable value of land and additions on the property. | Land | Improvement |
|---|---|---|---|---|
| 2025 | $2,801 | $44,744 | $18,638 | $26,106 |
| 2024 | $2,801 | $44,744 | $18,638 | $26,106 |
| 2023 | $2,763 | $35,979 | $20,857 | $18,807 |
| 2022 | $2,899 | $36,245 | $15,200 | $21,045 |
| 2021 | $2,936 | $37,287 | $15,637 | $21,650 |
| 2020 | $1,920 | $26,913 | $13,657 | $13,256 |
| 2019 | $1,890 | $26,913 | $13,657 | $13,256 |
| 2018 | $1,765 | $25,783 | $13,752 | $12,031 |
| 2017 | $1,741 | $28,505 | $15,204 | $13,301 |
| 2016 | $1,426 | $22,877 | $16,398 | $6,479 |
| 2015 | $1,359 | $17,647 | $4,696 | $12,951 |
| 2014 | $905 | $17,647 | $4,696 | $12,951 |
Source: Public Records
Map
Nearby Homes
- 835 Hillside Ct
- 2103 Rangeview Ln
- 818 Hover St
- 707 Longs Peak Ln
- 865 Widgeon Cir
- 883 Widgeon Cir
- 715 Hover St
- 895 Faith Ct
- 601 Loomis Ct
- 24 Cedar Ct
- 941 Reynolds Farm Ln Unit E8
- 813 Vivian St
- 1950 Spruce Ave
- 1845 3rd Ave
- 1037 Purdue Dr
- 1262 Lanyon Ln
- 1013 Berkeley Ct
- 1247 Linden St
- 1202 Vivian St
- 1245 Sumner St
- 815 Dickens Ct
- 835 Dickens Ct
- 824 Hillside Ct
- 830 Hillside Ct
- 820 Dickens Ct
- 814 Hillside Ct
- 830 Dickens Ct
- 2125 9th Ave
- 845 Dickens Ct
- 805 Dickens Ct
- 800 Dickens Ct
- 850 Dickens Ct
- 804 Hillside Ct
- 850 Hillside Ct
- 815 Panorama Cir
- 2107 9th Ave
- 821 Panorama Cir
- 825 Hillside Ct
- 815 Hillside Ct
- 2025 9th Ave