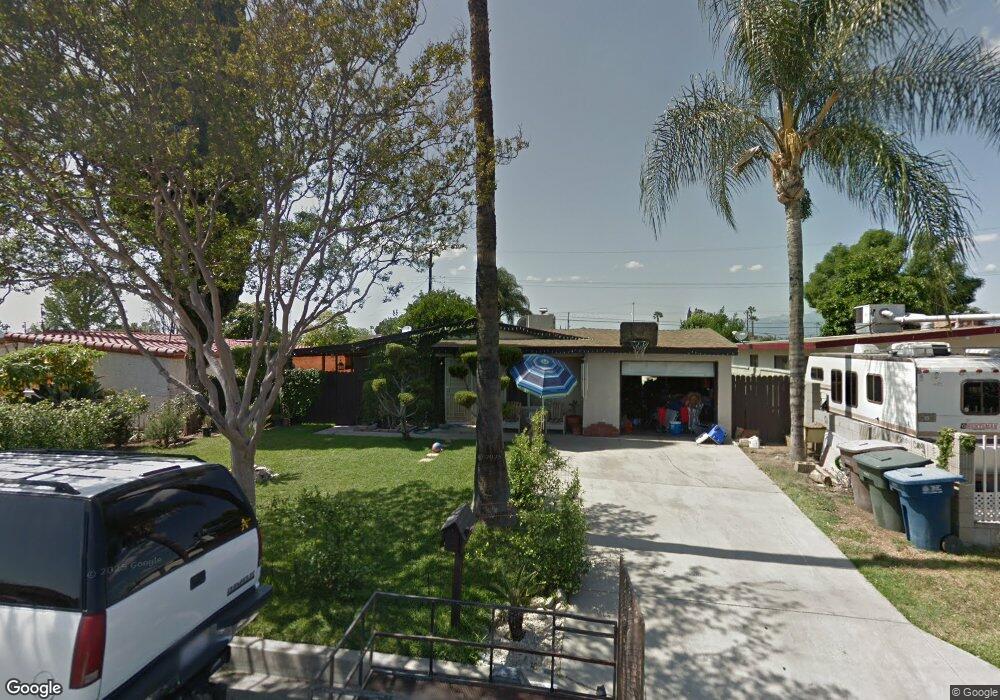
827 N Eldon Ave La Puente, CA 91744
Estimated Value: $694,531 - $767,000
4
Beds
2
Baths
1,140
Sq Ft
$643/Sq Ft
Est. Value
About This Home
This home is located at 827 N Eldon Ave, La Puente, CA 91744 and is currently estimated at $732,633, approximately $642 per square foot. 827 N Eldon Ave is a home located in Los Angeles County with nearby schools including Sparks Elementary School, Sparks Middle School, and La Puente High School.
Ownership History
Date
Name
Owned For
Owner Type
Purchase Details
Closed on
Oct 14, 2004
Sold by
Covani Enrique J
Bought by
Covani Enrique J
Current Estimated Value
Home Financials for this Owner
Home Financials are based on the most recent Mortgage that was taken out on this home.
Original Mortgage
$245,000
Outstanding Balance
$121,743
Interest Rate
5.82%
Mortgage Type
New Conventional
Estimated Equity
$610,890
Purchase Details
Closed on
Jul 19, 2001
Sold by
Eldon Avenue Trust #827
Bought by
Covani Enrique J
Home Financials for this Owner
Home Financials are based on the most recent Mortgage that was taken out on this home.
Original Mortgage
$160,921
Interest Rate
8.65%
Purchase Details
Closed on
Jan 17, 2001
Sold by
Lievanos Manuel
Bought by
Eldon Avenue Trust #827 and Shoreline Properties Llc
Create a Home Valuation Report for This Property
The Home Valuation Report is an in-depth analysis detailing your home's value as well as a comparison with similar homes in the area
Home Values in the Area
Average Home Value in this Area
Purchase History
| Date | Buyer | Sale Price | Title Company |
|---|---|---|---|
| Covani Enrique J | -- | First American Title Company | |
| Covani Enrique J | $184,500 | -- | |
| Eldon Avenue Trust #827 | $120,562 | -- |
Source: Public Records
Mortgage History
| Date | Status | Borrower | Loan Amount |
|---|---|---|---|
| Open | Covani Enrique J | $245,000 | |
| Closed | Covani Enrique J | $160,921 | |
| Closed | Covani Enrique J | $17,000 |
Source: Public Records
Tax History Compared to Growth
Tax History
| Year | Tax Paid | Tax Assessment Tax Assessment Total Assessment is a certain percentage of the fair market value that is determined by local assessors to be the total taxable value of land and additions on the property. | Land | Improvement |
|---|---|---|---|---|
| 2025 | $3,643 | $272,537 | $161,162 | $111,375 |
| 2024 | $3,643 | $267,194 | $158,002 | $109,192 |
| 2023 | $3,553 | $261,955 | $154,904 | $107,051 |
| 2022 | $3,453 | $256,819 | $151,867 | $104,952 |
| 2021 | $3,390 | $251,785 | $148,890 | $102,895 |
| 2019 | $3,297 | $244,319 | $144,475 | $99,844 |
| 2018 | $3,196 | $239,530 | $141,643 | $97,887 |
| 2016 | $2,968 | $230,231 | $136,144 | $94,087 |
| 2015 | $2,915 | $226,773 | $134,099 | $92,674 |
| 2014 | $2,874 | $222,332 | $131,473 | $90,859 |
Source: Public Records
Map
Nearby Homes
- 14972 Giordano St
- 15246 Temple Ave
- 829 Foxworth Ave
- 15625 Loukelton St
- 822 Greenberry Dr
- 15547 Temple Ave
- 15917 Mentz Ct
- 1084 Del Valle Ave
- 1329 N Stimson Ave
- 826 Del Valle Ave
- 357 Cadbrook Dr
- 1174 Del Valle Ave
- 1260 Greenberry Dr
- 932 Shadydale Ave
- 545 N 5th St
- 15732 Victoria Ave
- 665 Larimore Ave
- 14612 Hutchcroft St
- 15879 Hill St
- 15856 Cadwell St
- 833 N Eldon Ave
- 821 N Eldon Ave
- 826 Orrington Ave
- 832 Orrington Ave
- 820 Orrington Ave
- 839 N Eldon Ave
- 815 N Eldon Ave
- 826 N Eldon Ave
- 838 Orrington Ave
- 814 Orrington Ave
- 832 N Eldon Ave
- 820 N Eldon Ave
- 845 N Eldon Ave
- 809 N Eldon Ave
- 838 N Eldon Ave
- 814 N Eldon Ave
- 844 Orrington Ave
- 808 Orrington Ave
- 844 N Eldon Ave
- 808 N Eldon Ave