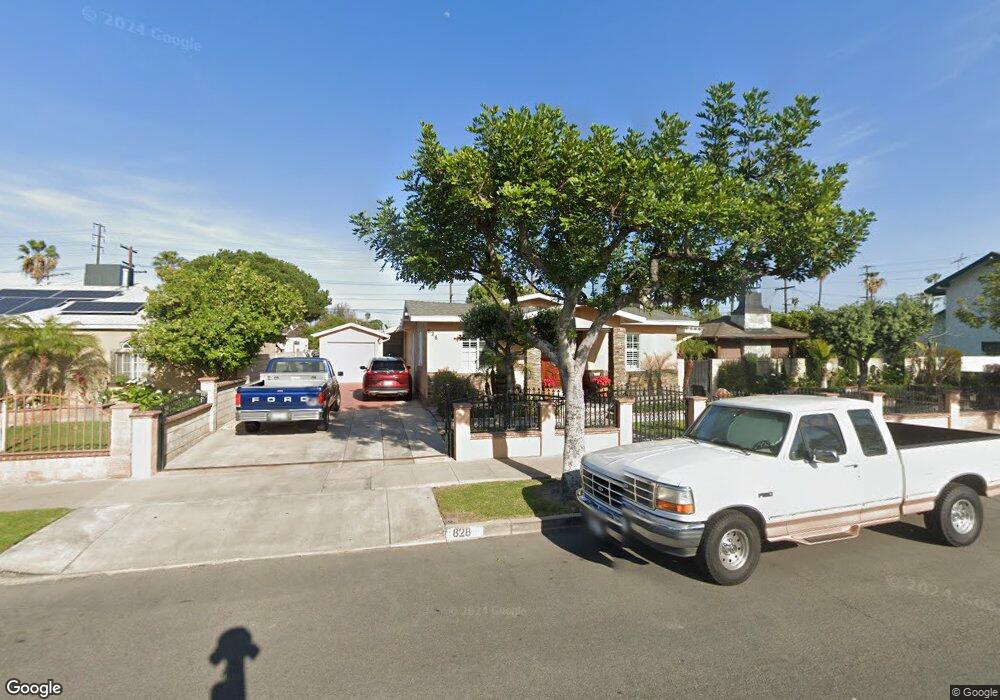
828 N Pine St Anaheim, CA 92805
Northwest Anaheim NeighborhoodEstimated Value: $874,000 - $1,070,000
3
Beds
3
Baths
1,784
Sq Ft
$542/Sq Ft
Est. Value
About This Home
This home is located at 828 N Pine St, Anaheim, CA 92805 and is currently estimated at $966,067, approximately $541 per square foot. 828 N Pine St is a home located in Orange County with nearby schools including Horace Mann Elementary School, Sycamore Junior High School, and Anaheim High School.
Ownership History
Date
Name
Owned For
Owner Type
Purchase Details
Closed on
Jul 16, 2021
Sold by
Saldivar Natalia R
Bought by
Miranda Sylvia S and The Jerez Irrevocable Living T
Current Estimated Value
Purchase Details
Closed on
Nov 24, 2020
Sold by
Miranda Sylvia S and The Jerez Irrevocable Living T
Bought by
Saldivar Roberto L and Saldivar Sylvia S
Home Financials for this Owner
Home Financials are based on the most recent Mortgage that was taken out on this home.
Original Mortgage
$303,900
Interest Rate
2.8%
Mortgage Type
New Conventional
Purchase Details
Closed on
Jul 13, 2015
Sold by
Saldivar Roberto Luna and Saldivar Maria Natalia
Bought by
Miranda Sylvia S and Jerez Irrevocable Living Trust
Purchase Details
Closed on
Dec 20, 1993
Sold by
Parekh Shanti P and Parekh Leena S
Bought by
Saldivar Roberto L and Saldivar Natalia R
Create a Home Valuation Report for This Property
The Home Valuation Report is an in-depth analysis detailing your home's value as well as a comparison with similar homes in the area
Home Values in the Area
Average Home Value in this Area
Purchase History
| Date | Buyer | Sale Price | Title Company |
|---|---|---|---|
| Miranda Sylvia S | -- | None Available | |
| Saldivar Roberto L | -- | First American Title Ins Co | |
| Miranda Sylvia S | -- | None Available | |
| Saldivar Roberto L | $111,500 | Commonwealth Land Title |
Source: Public Records
Mortgage History
| Date | Status | Borrower | Loan Amount |
|---|---|---|---|
| Previous Owner | Saldivar Roberto L | $303,900 |
Source: Public Records
Tax History
| Year | Tax Paid | Tax Assessment Tax Assessment Total Assessment is a certain percentage of the fair market value that is determined by local assessors to be the total taxable value of land and additions on the property. | Land | Improvement |
|---|---|---|---|---|
| 2025 | $1,725 | $131,020 | $69,208 | $61,812 |
| 2024 | $1,725 | $128,451 | $67,851 | $60,600 |
| 2023 | $1,684 | $125,933 | $66,521 | $59,412 |
| 2022 | $1,734 | $123,464 | $65,216 | $58,248 |
| 2021 | $1,733 | $121,044 | $63,938 | $57,106 |
| 2020 | $1,724 | $119,803 | $63,282 | $56,521 |
| 2019 | $1,681 | $117,454 | $62,041 | $55,413 |
| 2018 | $1,648 | $115,151 | $60,824 | $54,327 |
| 2017 | $1,590 | $112,894 | $59,632 | $53,262 |
| 2016 | $1,583 | $110,681 | $58,463 | $52,218 |
| 2015 | $1,489 | $109,019 | $57,585 | $51,434 |
| 2014 | $1,406 | $106,884 | $56,457 | $50,427 |
Source: Public Records
Map
Nearby Homes
- 743 N Janss St
- 716 N Harbor Blvd
- 934 N Citron St
- 1040 N Anaheim Blvd Unit 1
- 715 N Zeyn St
- 1121 N Anaheim Blvd
- 945 N Summer St
- 1090 N Anaheim Blvd Unit 1
- 1097 N Harbor Blvd
- 1089 N Harbor Blvd
- 1124 N Mayfair Ave
- 632 W Romneya Viaduct
- 639 N Carleton Ave
- 1173 N Mayfair Ave
- 117 E Sycamore St
- 211 N Resh St
- 1024 W Romneya Dr
- 1417 W James Way
- 318 N Claudina St
- 520 N Olive St
- 834 N Pine St
- 820 N Pine St
- 838 N Pine St
- 829 N Harbor Blvd
- 825 N Harbor Blvd
- 816 N Pine St
- 823 N Harbor Blvd
- 839 N Harbor Blvd
- 831 N Pine St
- 825 N Pine St
- 842 N Pine St
- 821 N Pine St
- 812 N Pine St
- 817 N Harbor Blvd
- 839 N Pine St
- 841 N Harbor Blvd
- 817 N Pine St
- 848 N Pine St
- 815 N Harbor Blvd
- 843 N Pine St
Your Personal Tour Guide
Ask me questions while you tour the home.