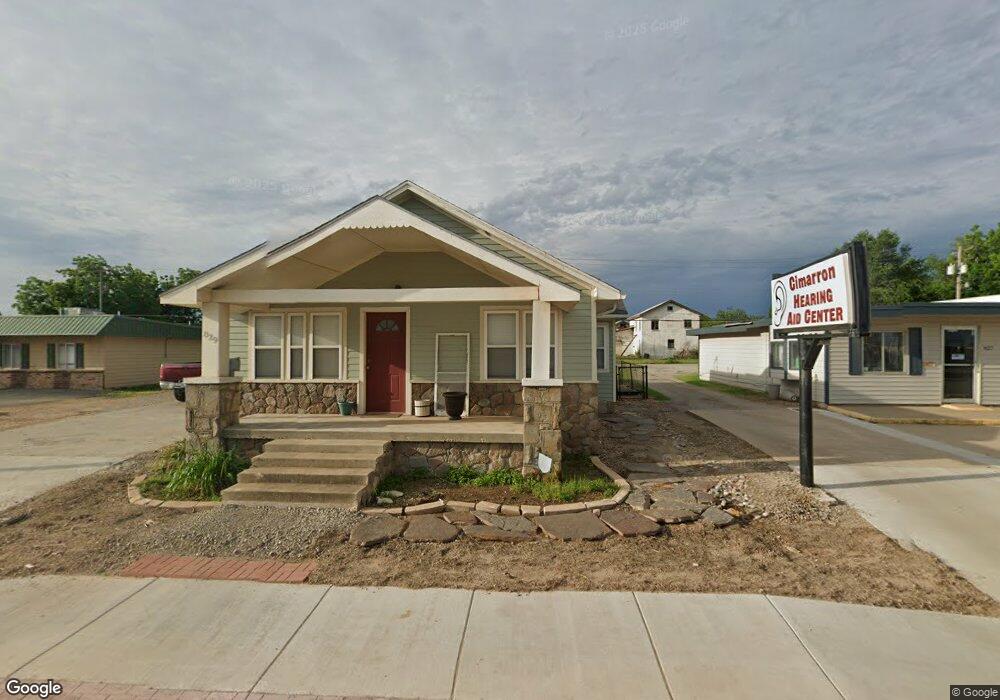
829 E Main St Cushing, OK 74023
Estimated Value: $84,000 - $141,000
2
Beds
2
Baths
1,162
Sq Ft
$104/Sq Ft
Est. Value
About This Home
This home is located at 829 E Main St, Cushing, OK 74023 and is currently estimated at $120,882, approximately $104 per square foot. 829 E Main St is a home located in Payne County with nearby schools including Cushing Upper Elementary School, Cushing Lower Elementary School, and Cushing High School.
Ownership History
Date
Name
Owned For
Owner Type
Purchase Details
Closed on
Aug 4, 2024
Sold by
Neilson Kai and Neilson Lyndse
Bought by
Build It Llc
Current Estimated Value
Purchase Details
Closed on
Apr 5, 2019
Sold by
Sylvester Louis N
Bought by
Neilson Kai and Neilson Lyndsey
Home Financials for this Owner
Home Financials are based on the most recent Mortgage that was taken out on this home.
Original Mortgage
$100,000
Interest Rate
4.3%
Mortgage Type
Seller Take Back
Purchase Details
Closed on
Apr 23, 2014
Sold by
Sylvester Richard G
Bought by
Sylvester Louis N
Create a Home Valuation Report for This Property
The Home Valuation Report is an in-depth analysis detailing your home's value as well as a comparison with similar homes in the area
Purchase History
| Date | Buyer | Sale Price | Title Company |
|---|---|---|---|
| Build It Llc | $85,000 | None Listed On Document | |
| Neilson Kai | $100,000 | Oklahoma Closing & Title Svc | |
| Sylvester Louis N | -- | None Available |
Source: Public Records
Mortgage History
| Date | Status | Borrower | Loan Amount |
|---|---|---|---|
| Previous Owner | Neilson Kai | $100,000 |
Source: Public Records
Tax History
| Year | Tax Paid | Tax Assessment Tax Assessment Total Assessment is a certain percentage of the fair market value that is determined by local assessors to be the total taxable value of land and additions on the property. | Land | Improvement |
|---|---|---|---|---|
| 2025 | $1,062 | $12,977 | $1,194 | $11,783 |
| 2024 | $1,100 | $12,977 | $1,194 | $11,783 |
| 2023 | $1,100 | $12,359 | $563 | $11,796 |
| 2022 | $1,003 | $11,771 | $640 | $11,131 |
| 2021 | $930 | $11,210 | $667 | $10,543 |
| 2020 | $874 | $10,677 | $741 | $9,936 |
| 2019 | $679 | $7,931 | $741 | $7,190 |
| 2018 | $658 | $7,931 | $741 | $7,190 |
| 2017 | $653 | $7,931 | $741 | $7,190 |
| 2016 | $670 | $7,931 | $741 | $7,190 |
| 2015 | $724 | $8,360 | $718 | $7,642 |
| 2014 | $386 | $4,479 | $718 | $3,761 |
Source: Public Records
Map
Nearby Homes
- 933 E Maple St
- 915 E Oak St
- 1001 E Pecan St
- 724 E Moses St
- 732 E Broadway St
- 708 E Broadway St
- 1002 E Cherry St
- 1133 E Pecan St
- 1129 E Vine St
- 616 E Cherry St
- 112 S Highland Ave
- 1236 E Main St
- 919 E 2nd St
- 612 E 2nd St
- 1301 E Ash St
- 1318 E Oak St
- 1224 E Cherry St
- 1217 E Cherry St
- 843 E 4th St
- 1003 E 4th St
- 834 E Walnut St
- 826 E Walnut St
- 838 E Walnut St
- 824 E Main St
- 824 E Walnut St
- 511 N Independence Ave
- 830 E Walnut St
- 848 E Main St Unit 846 E Main Street
- 848 E Main St
- 842 E Walnut St
- 848 E Walnut St
- 816 E Walnut St
- 820 E Walnut St
- 514 N Independence Ave
- 902 E Walnut St
- 812 E Walnut St
- 825 E Walnut St
- 831 E Walnut St
- 829 E Walnut St
- 835 E Walnut St
Your Personal Tour Guide
Ask me questions while you tour the home.