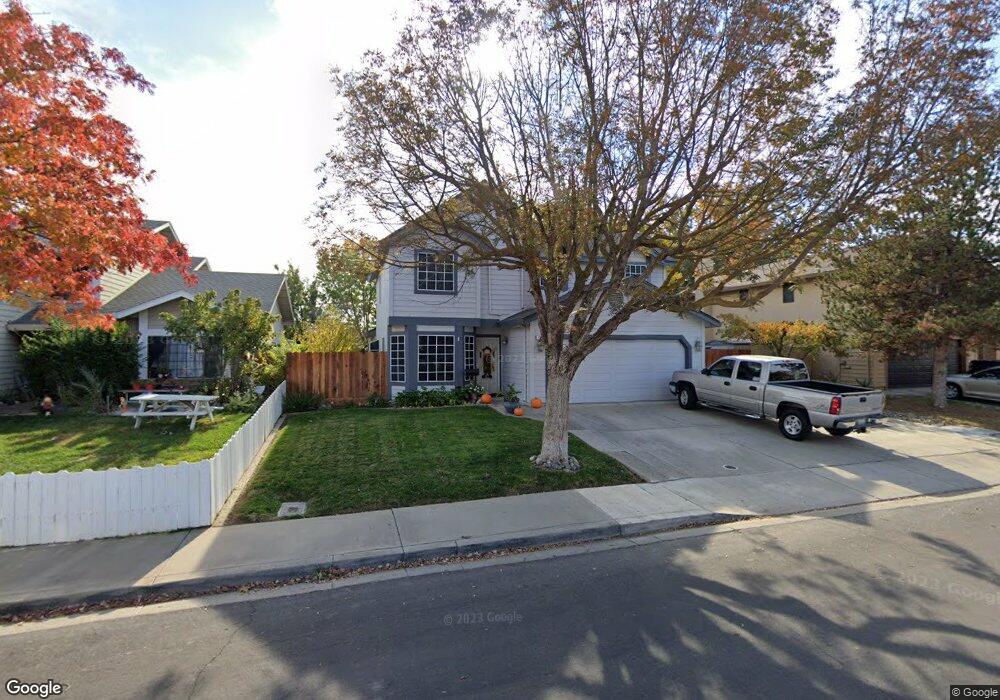
830 MacKilhaffy Dr Patterson, CA 95363
Estimated Value: $446,000 - $482,127
4
Beds
3
Baths
1,861
Sq Ft
$249/Sq Ft
Est. Value
About This Home
This home is located at 830 MacKilhaffy Dr, Patterson, CA 95363 and is currently estimated at $463,032, approximately $248 per square foot. 830 MacKilhaffy Dr is a home located in Stanislaus County with nearby schools including Las Palmas Elementary School, Creekside Middle School, and Patterson High School.
Ownership History
Date
Name
Owned For
Owner Type
Purchase Details
Closed on
Nov 17, 2020
Sold by
Rangel Marcos Estrella and Estrella Sara
Bought by
Rangel Marcos Estrella and Ortega Estrella Sara
Current Estimated Value
Purchase Details
Closed on
Feb 25, 1995
Sold by
Federal National Mortgage Association
Bought by
Estrella Marcos and Estrella Sara
Home Financials for this Owner
Home Financials are based on the most recent Mortgage that was taken out on this home.
Original Mortgage
$94,560
Interest Rate
8.9%
Purchase Details
Closed on
Dec 29, 1994
Sold by
Mellon Mtg Company
Bought by
Mellon Mtg Company
Home Financials for this Owner
Home Financials are based on the most recent Mortgage that was taken out on this home.
Original Mortgage
$94,560
Interest Rate
8.9%
Purchase Details
Closed on
Dec 9, 1994
Sold by
Mellon Mtg Company
Bought by
Federal National Mortgage Association
Create a Home Valuation Report for This Property
The Home Valuation Report is an in-depth analysis detailing your home's value as well as a comparison with similar homes in the area
Home Values in the Area
Average Home Value in this Area
Purchase History
| Date | Buyer | Sale Price | Title Company |
|---|---|---|---|
| Rangel Marcos Estrella | -- | None Available | |
| Estrella Marcos | $118,500 | Fidelity National Title | |
| Mellon Mtg Company | $1,117,500 | Fidelity National Title | |
| Federal National Mortgage Association | -- | Fidelity National Title |
Source: Public Records
Mortgage History
| Date | Status | Borrower | Loan Amount |
|---|---|---|---|
| Closed | Estrella Marcos | $94,560 |
Source: Public Records
Tax History
| Year | Tax Paid | Tax Assessment Tax Assessment Total Assessment is a certain percentage of the fair market value that is determined by local assessors to be the total taxable value of land and additions on the property. | Land | Improvement |
|---|---|---|---|---|
| 2025 | $2,337 | $200,108 | $50,382 | $149,726 |
| 2024 | $2,328 | $196,186 | $49,395 | $146,791 |
| 2023 | $2,277 | $192,340 | $48,427 | $143,913 |
| 2022 | $2,150 | $188,570 | $47,478 | $141,092 |
| 2021 | $2,119 | $184,874 | $46,548 | $138,326 |
| 2020 | $2,120 | $182,979 | $46,071 | $136,908 |
| 2019 | $2,087 | $179,392 | $45,168 | $134,224 |
| 2018 | $1,988 | $175,876 | $44,283 | $131,593 |
| 2017 | $1,947 | $172,428 | $43,415 | $129,013 |
| 2016 | $1,895 | $169,048 | $42,564 | $126,484 |
| 2015 | $1,831 | $166,510 | $41,925 | $124,585 |
| 2014 | $1,791 | $163,249 | $41,104 | $122,145 |
Source: Public Records
Map
Nearby Homes
- 850 Miraggio Dr
- 1008 Summer Ln
- 191 Fall Ave
- 708 Bonneau Ct
- 15707 S 9th St
- 1117 Van Gogh Ln
- 855 Toyon Ln
- 357 Wolfpack Ct
- 1132 Marsh Wren Ct
- 1127 Kestrel Dr
- 1242 Yellowhammer Dr
- 409 Osprey Dr
- 433 Sanderling Dr
- 403 Elfers Rd
- 425 Elfers Rd
- 1512 Marigold Dr
- 1413 Angus St
- 204 Daylily Ln
- 1314 Sutter Creek Ct
- 432 Meadow Creek Dr
- 826 MacKilhaffy Dr
- 834 MacKilhaffy Dr
- 838 MacKilhaffy Dr
- 822 MacKilhaffy Dr
- 829 MacKilhaffy Dr
- 833 MacKilhaffy Dr
- 825 MacKilhaffy Dr
- 818 MacKilhaffy Dr
- 842 MacKilhaffy Dr
- 837 MacKilhaffy Dr
- 821 MacKilhaffy Dr
- 841 MacKilhaffy Dr
- 846 MacKilhaffy Dr
- 814 MacKilhaffy Dr
- 828 Moray Ct
- 832 Moray Ct
- 569 Moray Way
- 836 Moray Ct
- 845 MacKilhaffy Dr
Your Personal Tour Guide
Ask me questions while you tour the home.