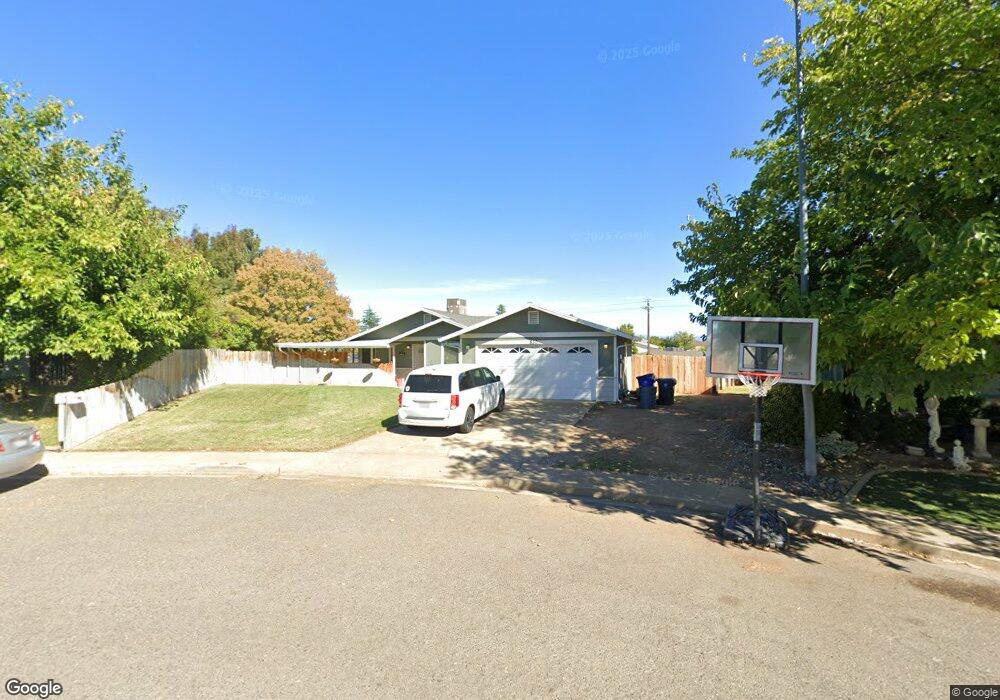
830 Otis Ct Red Bluff, CA 96080
Estimated Value: $308,000 - $331,000
4
Beds
2
Baths
1,236
Sq Ft
$258/Sq Ft
Est. Value
About This Home
This home is located at 830 Otis Ct, Red Bluff, CA 96080 and is currently estimated at $318,495, approximately $257 per square foot. 830 Otis Ct is a home located in Tehama County with nearby schools including William M. Metteer Elementary School, Vista Preparatory Academy, and Red Bluff High School.
Ownership History
Date
Name
Owned For
Owner Type
Purchase Details
Closed on
Oct 7, 2020
Sold by
Gibson Steven
Bought by
Affonso Beau W and Affonso Britney E
Current Estimated Value
Home Financials for this Owner
Home Financials are based on the most recent Mortgage that was taken out on this home.
Original Mortgage
$290,909
Outstanding Balance
$258,748
Interest Rate
2.9%
Mortgage Type
New Conventional
Estimated Equity
$59,747
Purchase Details
Closed on
Apr 6, 2020
Sold by
Jones Kevin L and Jones Tammy Laraine
Bought by
Gibson Steven
Purchase Details
Closed on
Oct 22, 2008
Sold by
Jones Kevin L and Jones Tammy L
Bought by
Jones Kevin L and Jones Tammy Laraine
Home Financials for this Owner
Home Financials are based on the most recent Mortgage that was taken out on this home.
Original Mortgage
$135,327
Interest Rate
5.77%
Mortgage Type
FHA
Create a Home Valuation Report for This Property
The Home Valuation Report is an in-depth analysis detailing your home's value as well as a comparison with similar homes in the area
Purchase History
| Date | Buyer | Sale Price | Title Company |
|---|---|---|---|
| Affonso Beau W | $288,000 | Northern California Title Co | |
| Gibson Steven | $158,000 | Placer Title Company | |
| Jones Kevin L | -- | Placer Title Company |
Source: Public Records
Mortgage History
| Date | Status | Borrower | Loan Amount |
|---|---|---|---|
| Open | Affonso Beau W | $290,909 | |
| Previous Owner | Jones Kevin L | $135,327 |
Source: Public Records
Tax History
| Year | Tax Paid | Tax Assessment Tax Assessment Total Assessment is a certain percentage of the fair market value that is determined by local assessors to be the total taxable value of land and additions on the property. | Land | Improvement |
|---|---|---|---|---|
| 2025 | $3,166 | $311,739 | $54,121 | $257,618 |
| 2023 | $3,113 | $299,635 | $52,020 | $247,615 |
| 2022 | $3,092 | $293,760 | $51,000 | $242,760 |
| 2021 | $2,967 | $288,000 | $50,000 | $238,000 |
| 2020 | $1,080 | $108,209 | $25,077 | $83,132 |
| 2019 | $1,086 | $106,088 | $24,586 | $81,502 |
| 2018 | $1,003 | $104,008 | $24,104 | $79,904 |
| 2017 | $1,010 | $101,970 | $23,632 | $78,338 |
| 2016 | $942 | $99,971 | $23,169 | $76,802 |
| 2015 | $927 | $98,470 | $22,821 | $75,649 |
| 2014 | $912 | $96,542 | $22,374 | $74,168 |
Source: Public Records
Map
Nearby Homes
- 1212 S Jackson St
- 10.94 S Jackson St
- 1210 Wetter Way
- 425 S Jackson St
- 406 S Jackson St
- 845 Olive St
- 1160 Orange St
- 810 Vista Way
- 131 Brookridge Dr Unit 1
- 821 Locust St
- 10.04 Vista Way
- 56.19 Vista Way
- 660 Villa Dr
- 224 S Jackson St
- 1235 Britt Ln
- 1560 Carl Ct
- 1307 Deborah Dr
- 1455 Acacia St
- 1480 Leonard Ln
- 1270 Aloha St
- 840 Otis Ct
- 820 Otis Ct
- 1220 S Jackson St
- 850 Otis Ct
- 810 Otis Ct
- 1130 S Jackson St
- 1230 S Jackson St
- 845 Otis Ct
- 860 Otis Ct
- 1120 S Jackson St
- 804 Otis Ct
- 820 Hasvold Dr
- 855 Otis Ct
- 810 Hasvold Dr
- 1255 Jackson St
- 910 Otis Ct
- 840 Hasvold Dr
- 1261 S Jackson St Unit South Jackson
- 1261 S Jackson St
- 805 Luther Rd
Your Personal Tour Guide
Ask me questions while you tour the home.