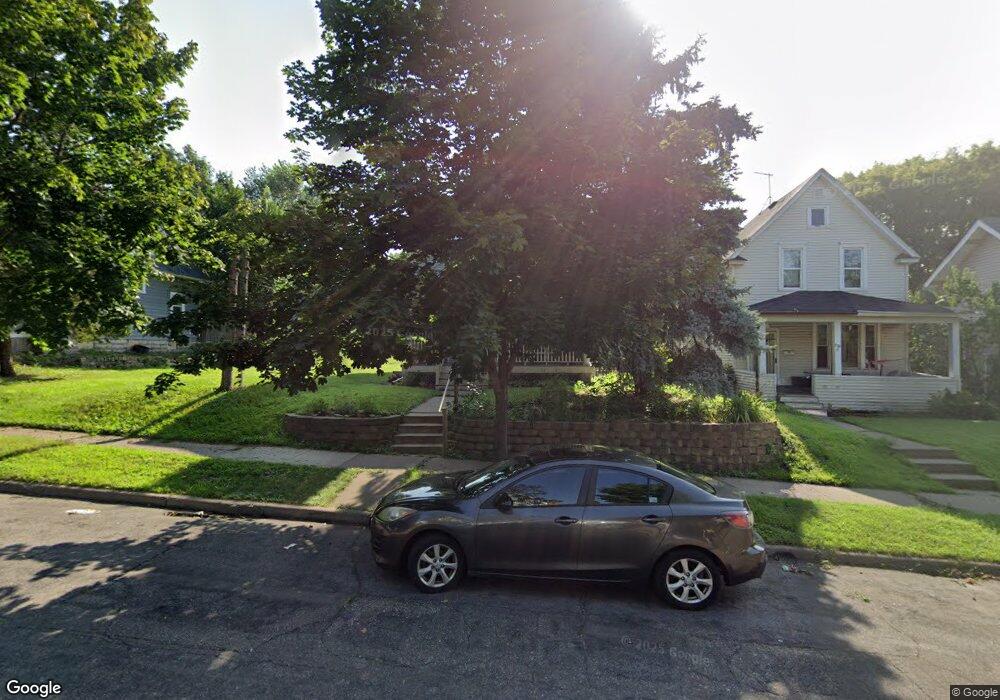
832 Burr St Saint Paul, MN 55130
Payne-Phalen NeighborhoodEstimated Value: $248,000 - $266,000
3
Beds
2
Baths
1,600
Sq Ft
$162/Sq Ft
Est. Value
About This Home
This home is located at 832 Burr St, Saint Paul, MN 55130 and is currently estimated at $259,940, approximately $162 per square foot. 832 Burr St is a home located in Ramsey County with nearby schools including Bruce F Vento Elementary School, Uncommon Schools Camden Prep - Mt. Ephraim Campus, and Creative Arts Secondary School.
Ownership History
Date
Name
Owned For
Owner Type
Purchase Details
Closed on
Jan 15, 2019
Sold by
Levine Jamie L and Nelson Katrina L
Bought by
Meyer Joseph and Oneil Eryn
Current Estimated Value
Home Financials for this Owner
Home Financials are based on the most recent Mortgage that was taken out on this home.
Original Mortgage
$199,820
Outstanding Balance
$174,979
Interest Rate
4.6%
Mortgage Type
New Conventional
Estimated Equity
$84,961
Purchase Details
Closed on
Mar 27, 2015
Sold by
Lemke Matthew J and Lemke Rebekah Marie
Bought by
Nelson Katrina L and Lavine Jamie L
Home Financials for this Owner
Home Financials are based on the most recent Mortgage that was taken out on this home.
Original Mortgage
$162,950
Interest Rate
3.37%
Mortgage Type
FHA
Purchase Details
Closed on
May 28, 2003
Sold by
Mroszak Francis Dennis and Mroszak Debbie
Bought by
Lemke Matthew J
Create a Home Valuation Report for This Property
The Home Valuation Report is an in-depth analysis detailing your home's value as well as a comparison with similar homes in the area
Home Values in the Area
Average Home Value in this Area
Purchase History
| Date | Buyer | Sale Price | Title Company |
|---|---|---|---|
| Meyer Joseph | $206,000 | Ancona Title & Escrow | |
| Nelson Katrina L | $170,909 | Burnet Title | |
| Lemke Matthew J | $144,000 | -- |
Source: Public Records
Mortgage History
| Date | Status | Borrower | Loan Amount |
|---|---|---|---|
| Open | Meyer Joseph | $199,820 | |
| Previous Owner | Nelson Katrina L | $162,950 |
Source: Public Records
Tax History Compared to Growth
Tax History
| Year | Tax Paid | Tax Assessment Tax Assessment Total Assessment is a certain percentage of the fair market value that is determined by local assessors to be the total taxable value of land and additions on the property. | Land | Improvement |
|---|---|---|---|---|
| 2025 | $3,186 | $249,000 | $25,000 | $224,000 |
| 2023 | $3,186 | $208,100 | $20,000 | $188,100 |
| 2022 | $3,370 | $232,900 | $20,000 | $212,900 |
| 2021 | $3,074 | $201,300 | $20,000 | $181,300 |
| 2020 | $2,806 | $199,000 | $6,900 | $192,100 |
| 2019 | $2,342 | $182,100 | $6,900 | $175,200 |
| 2018 | $2,250 | $154,300 | $6,900 | $147,400 |
| 2017 | $1,756 | $153,600 | $6,900 | $146,700 |
| 2016 | $1,420 | $0 | $0 | $0 |
| 2015 | $921 | $108,200 | $6,900 | $101,300 |
| 2014 | $1,810 | $0 | $0 | $0 |
Source: Public Records
Map
Nearby Homes