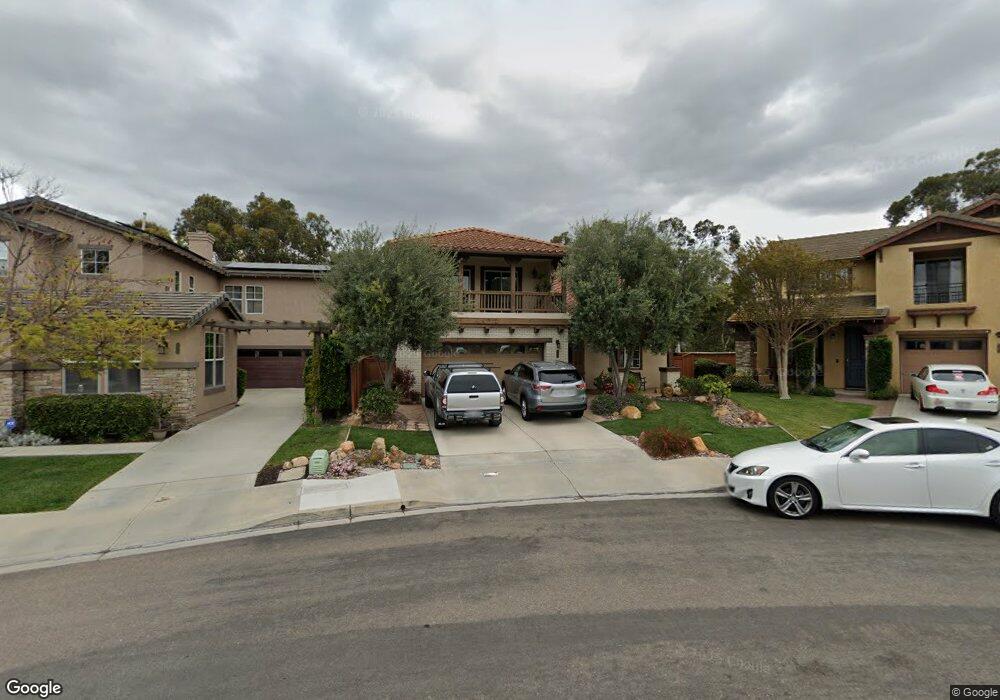
833 Esperanza Place Unit 6 Chula Vista, CA 91914
Rolling Hills Ranch NeighborhoodEstimated Value: $1,082,528 - $1,209,000
4
Beds
3
Baths
2,429
Sq Ft
$482/Sq Ft
Est. Value
About This Home
This home is located at 833 Esperanza Place Unit 6, Chula Vista, CA 91914 and is currently estimated at $1,170,882, approximately $482 per square foot. 833 Esperanza Place Unit 6 is a home located in San Diego County with nearby schools including Thurgood Marshall Elementary School, Eastlake Middle School, and Eastlake High School.
Ownership History
Date
Name
Owned For
Owner Type
Purchase Details
Closed on
Aug 28, 2012
Sold by
Weihe Douglas L and Weihe Darlene A
Bought by
Weihe Douglas Lee and Weihe Darlene Ann
Current Estimated Value
Home Financials for this Owner
Home Financials are based on the most recent Mortgage that was taken out on this home.
Original Mortgage
$327,600
Outstanding Balance
$225,614
Interest Rate
3.47%
Mortgage Type
New Conventional
Estimated Equity
$945,268
Purchase Details
Closed on
Nov 7, 2011
Sold by
Weihe Douglas L and Weihe Darlene A
Bought by
Weihe Douglas Lee and Weihe Darlene Ann
Purchase Details
Closed on
Aug 13, 2001
Sold by
Pacific Bay Properties
Bought by
Weihe Douglas L and Weihe Darlene A
Home Financials for this Owner
Home Financials are based on the most recent Mortgage that was taken out on this home.
Original Mortgage
$275,000
Interest Rate
6.91%
Create a Home Valuation Report for This Property
The Home Valuation Report is an in-depth analysis detailing your home's value as well as a comparison with similar homes in the area
Home Values in the Area
Average Home Value in this Area
Purchase History
| Date | Buyer | Sale Price | Title Company |
|---|---|---|---|
| Weihe Douglas Lee | -- | Accommodation | |
| Weihe Douglas L | -- | Lsi Title Company | |
| Weihe Douglas Lee | -- | None Available | |
| Weihe Douglas L | $386,000 | First American Title |
Source: Public Records
Mortgage History
| Date | Status | Borrower | Loan Amount |
|---|---|---|---|
| Open | Weihe Douglas L | $327,600 | |
| Previous Owner | Weihe Douglas L | $275,000 |
Source: Public Records
Tax History Compared to Growth
Tax History
| Year | Tax Paid | Tax Assessment Tax Assessment Total Assessment is a certain percentage of the fair market value that is determined by local assessors to be the total taxable value of land and additions on the property. | Land | Improvement |
|---|---|---|---|---|
| 2025 | $4,631 | $579,144 | $147,720 | $431,424 |
| 2024 | $4,631 | $567,789 | $144,824 | $422,965 |
| 2023 | $4,617 | $556,657 | $141,985 | $414,672 |
| 2022 | $4,580 | $545,743 | $139,201 | $406,542 |
| 2021 | $4,466 | $535,043 | $136,472 | $398,571 |
| 2020 | $4,395 | $529,558 | $135,073 | $394,485 |
| 2019 | $4,201 | $511,175 | $132,425 | $378,750 |
| 2018 | $4,156 | $501,153 | $129,829 | $371,324 |
| 2017 | $12 | $491,328 | $127,284 | $364,044 |
| 2016 | $3,990 | $481,695 | $124,789 | $356,906 |
| 2015 | $3,930 | $474,460 | $122,915 | $351,545 |
| 2014 | $3,845 | $465,167 | $120,508 | $344,659 |
Source: Public Records
Map
Nearby Homes
- 771 Dry Creek Dr
- 760 N Fox Run Place
- 2532 Oak Knoll Ct
- 728 Crooked Path Place Unit 2
- 986 White Alder Ave
- 1001 White Alder Ave
- 2706 Valleycreek Cir
- 2790 Silver Oak Ct
- 2890 Gate Fifteen Place
- 2567 View Trail Ct Unit 1
- 2910 Gate Thirteen Place
- 2383 Forest Oaks Dr
- 544 Rocking Horse Dr
- 2917 Babbling Brook Rd
- 2264 Huntington Point Rd Unit 102
- 1020 Baywood Cir Unit E
- 2170 Lago Ventana
- 671 Via Maggiore
- 1238 Silver Hawk Way
- 2946 Ranch Gate Rd
- 829 Esperanza Place
- 837 Esperanza Place Unit 6
- 825 Esperanza Place
- 845 Esperanza Place Unit 6
- 821 Esperanza Place
- 828 Esperanza Place Unit 6
- 820 Esperanza Place Unit 6
- 849 Esperanza Place
- 817 Esperanza Place
- 816 Esperanza Place Unit 6
- 853 Esperanza Place
- 813 Esperanza Place Unit 6
- 856 Esperanza Place
- 812 Esperanza Place
- 857 Esperanza Place
- 809 Esperanza Place Unit 6
- 864 Esperanza Place
- 808 Esperanza Place Unit 6
- 861 Esperanza Place
- 805 Esperanza Place