Estimated Value: $359,877 - $439,000
Studio
2
Baths
1,426
Sq Ft
$278/Sq Ft
Est. Value
About This Home
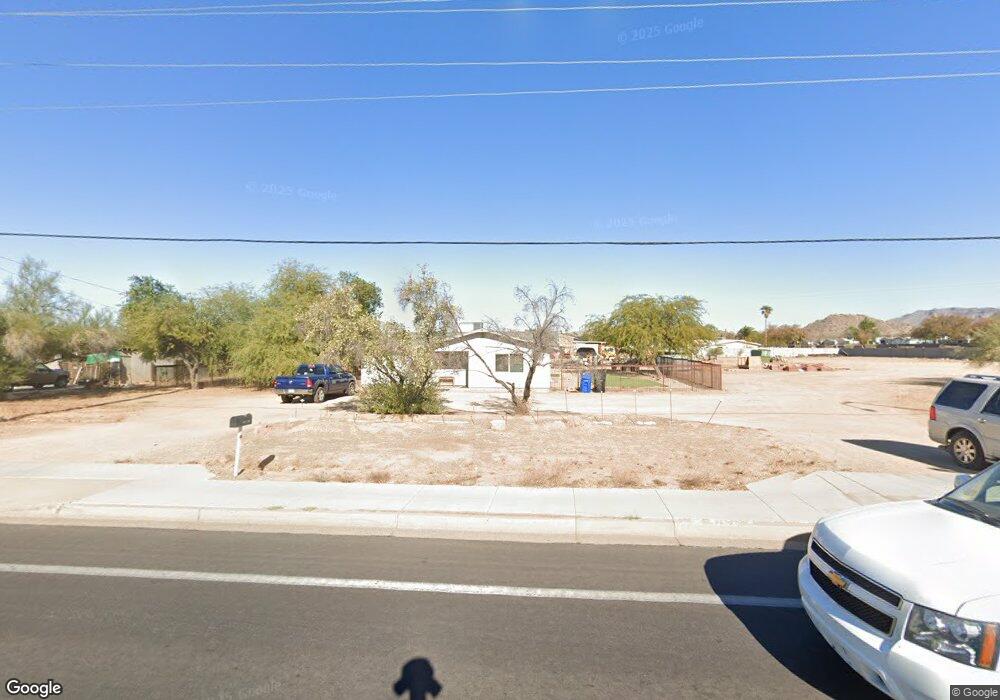
This home is located at 8332 E University Dr, Mesa, AZ 85207 and is currently estimated at $396,969, approximately $278 per square foot. 8332 E University Dr is a home located in Maricopa County with nearby schools including Salk Elementary School, Franklin at Brimhall Elementary School, and Franklin West Elementary School.
Ownership History
Date
Name
Owned For
Owner Type
Purchase Details
Closed on
Oct 22, 2021
Sold by
Paz Jose O and Paz Ivonne
Bought by
Paz Ivonne
Current Estimated Value
Purchase Details
Closed on
Aug 17, 2005
Sold by
Gutierrez Ivonne S
Bought by
Paz Jose O
Home Financials for this Owner
Home Financials are based on the most recent Mortgage that was taken out on this home.
Original Mortgage
$131,520
Outstanding Balance
$77,037
Interest Rate
7.5%
Mortgage Type
Purchase Money Mortgage
Estimated Equity
$319,932
Purchase Details
Closed on
Dec 5, 2000
Sold by
Mcwilliams Dusty A and Mcwilliams Gail L
Bought by
Western Devco Llc
Home Financials for this Owner
Home Financials are based on the most recent Mortgage that was taken out on this home.
Original Mortgage
$120,000
Interest Rate
7.66%
Mortgage Type
Purchase Money Mortgage
Create a Home Valuation Report for This Property
The Home Valuation Report is an in-depth analysis detailing your home's value as well as a comparison with similar homes in the area
Purchase History
| Date | Buyer | Sale Price | Title Company |
|---|---|---|---|
| Paz Ivonne | -- | None Available | |
| Paz Jose O | -- | Lawyers Title Ins | |
| Paz Jose O | $164,400 | Lawyers Title Ins | |
| Western Devco Llc | $120,000 | Lawyers Title Of Arizona Inc |
Source: Public Records
Mortgage History
| Date | Status | Borrower | Loan Amount |
|---|---|---|---|
| Open | Paz Jose O | $131,520 | |
| Closed | Paz Jose O | $131,520 | |
| Previous Owner | Western Devco Llc | $120,000 |
Source: Public Records
Tax History Compared to Growth
Tax History
| Year | Tax Paid | Tax Assessment Tax Assessment Total Assessment is a certain percentage of the fair market value that is determined by local assessors to be the total taxable value of land and additions on the property. | Land | Improvement |
|---|---|---|---|---|
| 2025 | $1,515 | $18,217 | -- | -- |
| 2024 | $1,531 | $17,349 | -- | -- |
| 2023 | $1,531 | $29,400 | $5,880 | $23,520 |
| 2022 | $1,497 | $25,470 | $5,090 | $20,380 |
| 2021 | $1,538 | $21,720 | $4,340 | $17,380 |
| 2020 | $1,085 | $18,070 | $3,610 | $14,460 |
| 2019 | $1,005 | $16,960 | $3,390 | $13,570 |
| 2018 | $960 | $14,120 | $2,820 | $11,300 |
| 2017 | $930 | $12,500 | $2,500 | $10,000 |
| 2016 | $913 | $11,060 | $2,210 | $8,850 |
Source: Public Records
Map
Nearby Homes
- 244 N Hawes Rd
- 8125 E Billings St
- 8232 E Albany St
- 500 Lane Unit 510
- 226 N 81st St
- 8707 E Butte St
- 8001 E Colby St
- 301 N 87th St
- 8049 E Des Moines St
- 8702 E Boise St
- 7927 E Caballero St
- 8213 E Main St
- 8802 E University Dr Unit 53
- 7947 E Des Moines St
- 8810 E Colby Cir Unit 2
- 7940 E Dartmouth St
- 8008 E Main St
- 217 N 88th Place
- 8700 E University Dr Unit 632
- 8700 E University Dr Unit 2732
- 8328 E University Dr
- 8358 E University Dr Unit 13
- 415 N 83rd Place
- 415 N 83rd Place
- 420 N 83rd Place
- 420 N 83rd Place
- 8337 E University Dr
- 8302 E University Dr
- 355 N 83rd St
- 434 N Hawes Rd
- 417 N 83rd St
- 8399 E University Dr
- 425 N 83rd St
- 438 N Hawes Rd
- 454 N Hawes Rd Unit 14
- 454 N Hawes Rd
- 8401 E University Dr
- 429 N 83rd St
- 334 N 83rd Place
- 338 N Hawes Rd