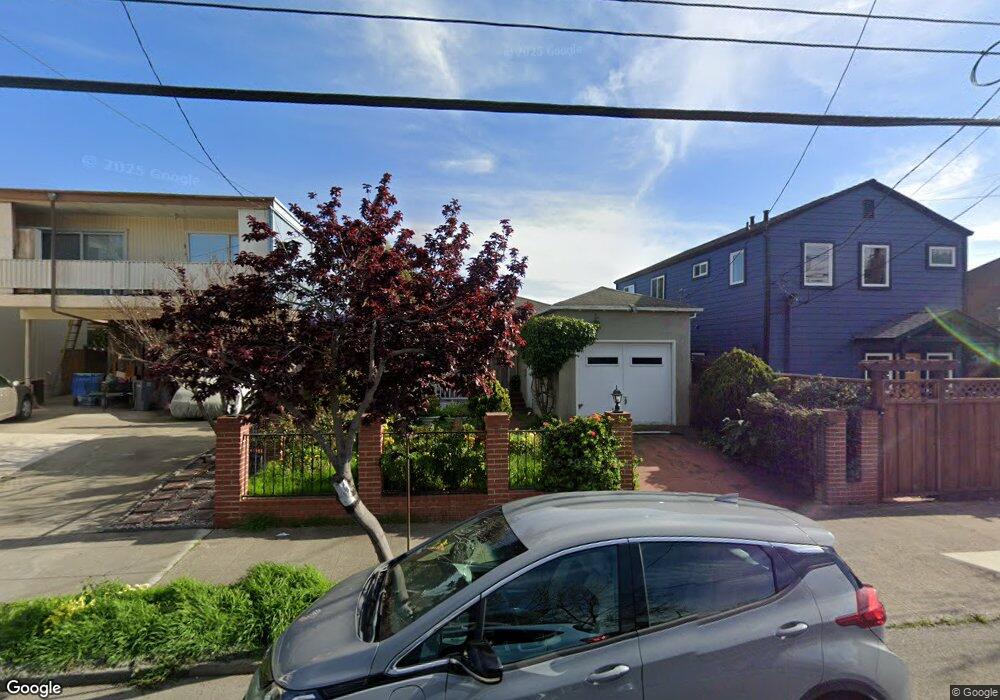
834 Channing Way Berkeley, CA 94710
West Berkeley NeighborhoodEstimated Value: $775,000 - $991,000
3
Beds
1
Bath
1,008
Sq Ft
$910/Sq Ft
Est. Value
About This Home
This home is located at 834 Channing Way, Berkeley, CA 94710 and is currently estimated at $917,279, approximately $909 per square foot. 834 Channing Way is a home located in Alameda County with nearby schools including Rosa Parks Elementary School, Ruth Acty Elementary, and Berkeley Arts Magnet at Whittier School.
Ownership History
Date
Name
Owned For
Owner Type
Purchase Details
Closed on
Aug 30, 2002
Sold by
Cox Dorothy D and Cabral Adolfo A
Bought by
Cabral Adolfo A and Cox Dorothy D
Current Estimated Value
Home Financials for this Owner
Home Financials are based on the most recent Mortgage that was taken out on this home.
Original Mortgage
$261,300
Outstanding Balance
$109,552
Interest Rate
6.29%
Estimated Equity
$807,727
Purchase Details
Closed on
Oct 4, 2000
Sold by
Gonzalez Abel and Gonzalez Maria
Bought by
Cox Dorothy D and Cabral Adolfo A
Home Financials for this Owner
Home Financials are based on the most recent Mortgage that was taken out on this home.
Original Mortgage
$220,000
Interest Rate
8.01%
Purchase Details
Closed on
Jun 16, 1997
Sold by
Ramsey Jesse L
Bought by
Gonzalez Abel and Gonzalez Maria
Home Financials for this Owner
Home Financials are based on the most recent Mortgage that was taken out on this home.
Original Mortgage
$139,315
Interest Rate
7.94%
Mortgage Type
FHA
Create a Home Valuation Report for This Property
The Home Valuation Report is an in-depth analysis detailing your home's value as well as a comparison with similar homes in the area
Home Values in the Area
Average Home Value in this Area
Purchase History
| Date | Buyer | Sale Price | Title Company |
|---|---|---|---|
| Cabral Adolfo A | -- | First American Title Guarant | |
| Cox Dorothy D | $275,000 | Placer Title Company | |
| Gonzalez Abel | $140,500 | American Title Co |
Source: Public Records
Mortgage History
| Date | Status | Borrower | Loan Amount |
|---|---|---|---|
| Open | Cabral Adolfo A | $261,300 | |
| Closed | Cox Dorothy D | $220,000 | |
| Previous Owner | Gonzalez Abel | $139,315 | |
| Closed | Cox Dorothy D | $41,250 |
Source: Public Records
Tax History
| Year | Tax Paid | Tax Assessment Tax Assessment Total Assessment is a certain percentage of the fair market value that is determined by local assessors to be the total taxable value of land and additions on the property. | Land | Improvement |
|---|---|---|---|---|
| 2025 | $6,836 | $407,350 | $124,305 | $290,045 |
| 2024 | $6,836 | $399,227 | $121,868 | $284,359 |
| 2023 | $6,686 | $398,262 | $119,478 | $278,784 |
| 2022 | $6,552 | $383,455 | $117,136 | $273,319 |
| 2021 | $6,556 | $375,800 | $114,840 | $267,960 |
| 2020 | $6,187 | $378,875 | $113,662 | $265,213 |
| 2019 | $5,921 | $371,447 | $111,434 | $260,013 |
| 2018 | $5,814 | $364,165 | $109,249 | $254,916 |
| 2017 | $5,586 | $357,026 | $107,108 | $249,918 |
| 2016 | $5,387 | $350,027 | $105,008 | $245,019 |
| 2015 | $5,312 | $344,772 | $103,431 | $241,341 |
| 2014 | $5,268 | $338,021 | $101,406 | $236,615 |
Source: Public Records
Map
Nearby Homes
- 2411 Sixth St
- 917 Channing Way
- 2238 7th St
- 2414 5th St
- 2220 7th St
- 931 Bancroft Way
- 2341 9th St
- 1050 Allston Way
- 2241 Ninth St
- 2327 10th St Unit 4
- 1039 Channing Way
- 2231 Byron St
- 1118 Dwight Way
- 2013 9th St
- 1142 Dwight Way
- 1144 Dwight Way
- 2324 Browning St
- 1135 Parker St
- 1010 Grayson St
- 1034 Grayson St
Your Personal Tour Guide
Ask me questions while you tour the home.