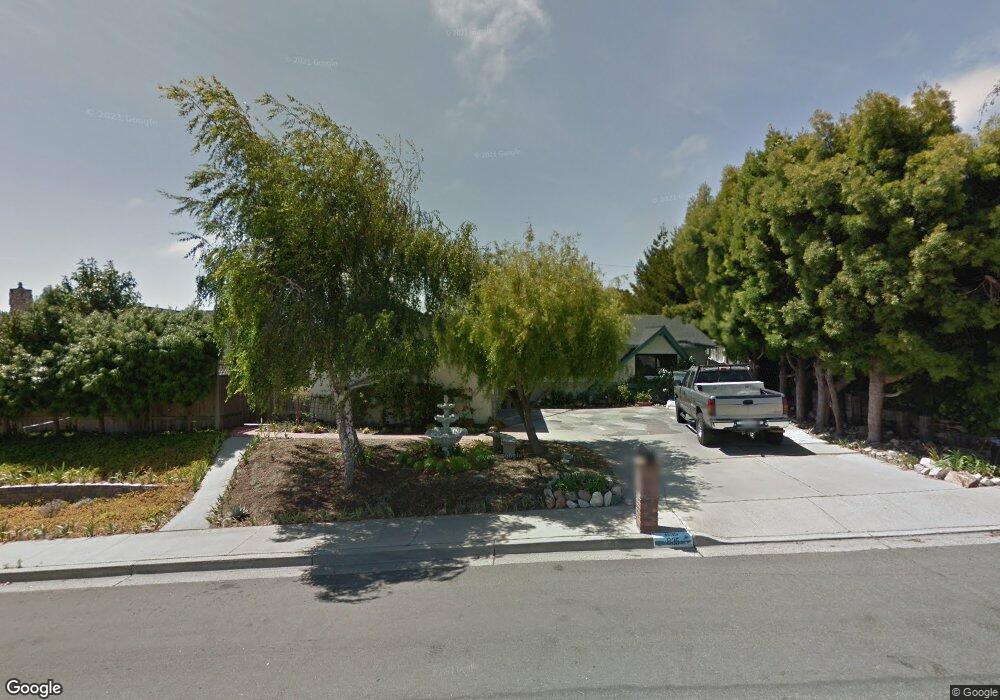
835 Olive St Arroyo Grande, CA 93420
Estimated Value: $531,000 - $802,000
3
Beds
2
Baths
1,161
Sq Ft
$595/Sq Ft
Est. Value
About This Home
This home is located at 835 Olive St, Arroyo Grande, CA 93420 and is currently estimated at $690,513, approximately $594 per square foot. 835 Olive St is a home located in San Luis Obispo County with nearby schools including Harloe Elementary School, Paulding Middle School, and Arroyo Grande High School.
Ownership History
Date
Name
Owned For
Owner Type
Purchase Details
Closed on
Apr 17, 2002
Sold by
Johnson Melvin H and Johnson Marlene L
Bought by
Johnson Melvin H and Johnson Marlene L
Current Estimated Value
Home Financials for this Owner
Home Financials are based on the most recent Mortgage that was taken out on this home.
Original Mortgage
$200,000
Interest Rate
7.08%
Create a Home Valuation Report for This Property
The Home Valuation Report is an in-depth analysis detailing your home's value as well as a comparison with similar homes in the area
Home Values in the Area
Average Home Value in this Area
Purchase History
| Date | Buyer | Sale Price | Title Company |
|---|---|---|---|
| Johnson Melvin H | -- | First American Title Co | |
| Johnson Melvin H | -- | First American Title Co |
Source: Public Records
Mortgage History
| Date | Status | Borrower | Loan Amount |
|---|---|---|---|
| Closed | Johnson Melvin H | $200,000 |
Source: Public Records
Tax History
| Year | Tax Paid | Tax Assessment Tax Assessment Total Assessment is a certain percentage of the fair market value that is determined by local assessors to be the total taxable value of land and additions on the property. | Land | Improvement |
|---|---|---|---|---|
| 2025 | $877 | $84,787 | $27,126 | $57,661 |
| 2024 | $867 | $83,126 | $26,595 | $56,531 |
| 2023 | $867 | $81,497 | $26,074 | $55,423 |
| 2022 | $854 | $79,900 | $25,563 | $54,337 |
| 2021 | $852 | $78,334 | $25,062 | $53,272 |
| 2020 | $843 | $77,532 | $24,806 | $52,726 |
| 2019 | $759 | $76,013 | $24,320 | $51,693 |
| 2018 | $749 | $74,524 | $23,844 | $50,680 |
| 2017 | $735 | $73,064 | $23,377 | $49,687 |
| 2016 | $693 | $71,632 | $22,919 | $48,713 |
| 2015 | $686 | $70,557 | $22,575 | $47,982 |
| 2014 | $660 | $69,176 | $22,133 | $47,043 |
Source: Public Records
Map
Nearby Homes
- 555 S Halcyon Rd
- 403 Beech St
- 326 Cerro Vista Ln Unit Lot 5
- 341 Cerro Vista Ln Unit Lot 19
- 359 Cerro Vista Ln Unit Lot 22
- 359 Cerro Vista Ln
- 655 S Halcyon Rd Unit 1
- 655 S Halcyon Rd Unit 7
- 727 S Halcyon Rd Unit 3
- 612 Gaynfair Terrace
- 245 Walnut St
- 1178 Pacific Pointe Way
- 1158 Pacific Pointe Way
- 1065 Sunset Dr
- 1189 Pacific Pointe Way
- 1165 Maple St Unit E
- 100 Oak St
- 830 Pearl Dr
- 414 E Grand Ave
- 1120 Sunset Dr
Your Personal Tour Guide
Ask me questions while you tour the home.