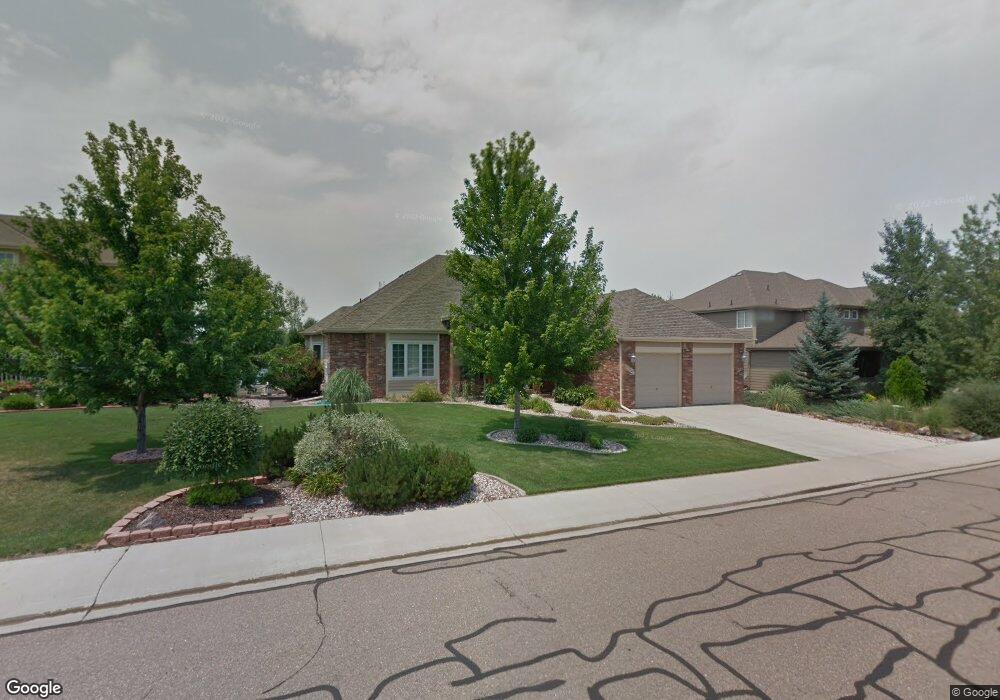
8352 Louden Cir Fort Collins, CO 80528
Estimated Value: $737,314 - $825,000
3
Beds
4
Baths
2,493
Sq Ft
$313/Sq Ft
Est. Value
About This Home
This home is located at 8352 Louden Cir, Fort Collins, CO 80528 and is currently estimated at $780,579, approximately $313 per square foot. 8352 Louden Cir is a home located in Larimer County with nearby schools including Colorado Early Colleges Windsor, Westgate KinderCare, and Resurrection Christian School.
Ownership History
Date
Name
Owned For
Owner Type
Purchase Details
Closed on
Sep 13, 2002
Sold by
Greenfield Randall S and Shaffer Linda Sue
Bought by
Greenfield Randall S and Greenfield Linda Sue
Current Estimated Value
Home Financials for this Owner
Home Financials are based on the most recent Mortgage that was taken out on this home.
Original Mortgage
$294,000
Outstanding Balance
$111,664
Interest Rate
5%
Estimated Equity
$668,915
Purchase Details
Closed on
Oct 2, 2001
Sold by
Paul Schroer Homes Llc
Bought by
Greenfield Randall S and Shaffer Linda Sue
Home Financials for this Owner
Home Financials are based on the most recent Mortgage that was taken out on this home.
Original Mortgage
$255,000
Interest Rate
6.88%
Purchase Details
Closed on
Nov 22, 1999
Sold by
Country Farms Llc
Bought by
Paul Schroer Homes Llc
Create a Home Valuation Report for This Property
The Home Valuation Report is an in-depth analysis detailing your home's value as well as a comparison with similar homes in the area
Home Values in the Area
Average Home Value in this Area
Purchase History
| Date | Buyer | Sale Price | Title Company |
|---|---|---|---|
| Greenfield Randall S | -- | -- | |
| Greenfield Randall S | $364,121 | -- | |
| Paul Schroer Homes Llc | $72,000 | -- |
Source: Public Records
Mortgage History
| Date | Status | Borrower | Loan Amount |
|---|---|---|---|
| Open | Greenfield Randall S | $294,000 | |
| Closed | Greenfield Randall S | $255,000 |
Source: Public Records
Tax History Compared to Growth
Tax History
| Year | Tax Paid | Tax Assessment Tax Assessment Total Assessment is a certain percentage of the fair market value that is determined by local assessors to be the total taxable value of land and additions on the property. | Land | Improvement |
|---|---|---|---|---|
| 2025 | $5,004 | $49,935 | $13,400 | $36,535 |
| 2024 | $4,791 | $49,935 | $13,400 | $36,535 |
| 2022 | $4,083 | $38,197 | $7,179 | $31,018 |
| 2021 | $4,125 | $39,296 | $7,386 | $31,910 |
| 2020 | $4,226 | $39,919 | $7,386 | $32,533 |
| 2019 | $4,241 | $39,919 | $7,386 | $32,533 |
| 2018 | $3,832 | $37,232 | $7,438 | $29,794 |
| 2017 | $3,826 | $37,232 | $7,438 | $29,794 |
| 2016 | $3,643 | $35,287 | $8,223 | $27,064 |
| 2015 | $3,602 | $35,280 | $8,220 | $27,060 |
| 2014 | $3,265 | $31,610 | $8,220 | $23,390 |
Source: Public Records
Map
Nearby Homes
- 5013 Country Farms Dr
- 8119 Lighthouse Ln
- 8412 Cromwell Cir
- 8482 Cromwell Dr Unit 6
- 5375 Trade Wind Ct
- 8420 SE Frontage Rd S
- 8420 SE Frontage Rd
- 6671 Spanish Bay Dr
- 8332 Peakview Dr
- 8264 Scenic Ridge Ct
- 6787 Spanish Bay Dr
- 6535 Half Moon Bay Dr
- 5442 Tiller Ct
- 8269 Park Hill Ct
- 5390 Promontory Cir
- 5304 Vardon Way
- 6558 Murano Dr
- 0 Tract Q Windsor Villages Unit 1031195
- 6618 Crystal Downs Dr Unit 201
- 6682 Crooked Stick Dr
- 8348 Louden Cir
- 8360 Louden Cir
- 8344 Louden Cir
- 8340 Louden Cir
- 8368 Louden Cir
- 8347 Louden Cir
- 8334 Louden Cir
- 8110 Louden Crossing
- 8363 Louden Cir
- 8114 Louden Crossing
- 8330 Louden Cir
- 8374 Louden Cir
- 8120 Louden Crossing
- 8339 Louden Cir
- 8343 Louden Cir
- 8326 Louden Cir
- 8126 Louden Crossing
- 8233 Lighthouse Lane Ct
- 8322 Louden Cir
- 8335 Louden Cir