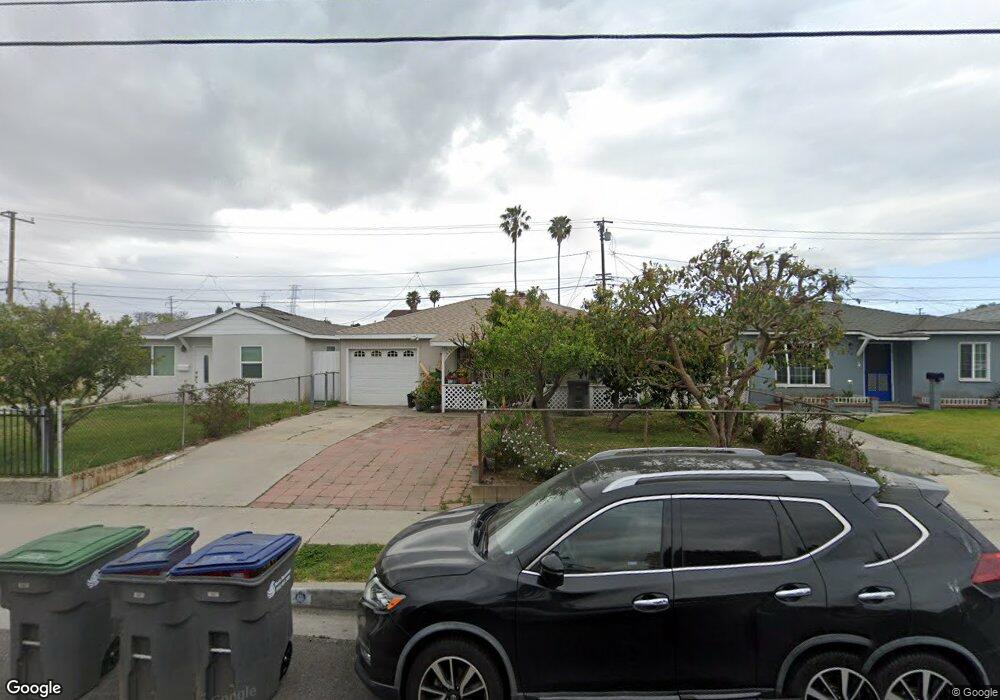
836 E Sepulveda Blvd Carson, CA 90745
Estimated Value: $538,950 - $654,000
2
Beds
1
Bath
756
Sq Ft
$796/Sq Ft
Est. Value
About This Home
This home is located at 836 E Sepulveda Blvd, Carson, CA 90745 and is currently estimated at $601,988, approximately $796 per square foot. 836 E Sepulveda Blvd is a home located in Los Angeles County with nearby schools including Broad Avenue Elementary School, Wilmington Middle School STEAM Magnet, and Phineas Banning Senior High School.
Ownership History
Date
Name
Owned For
Owner Type
Purchase Details
Closed on
Aug 5, 2016
Sold by
Rodriguez Antonio Cortez
Bought by
Rodriguez Antonio Cortez and Cortez Martha
Current Estimated Value
Home Financials for this Owner
Home Financials are based on the most recent Mortgage that was taken out on this home.
Original Mortgage
$197,650
Outstanding Balance
$124,286
Interest Rate
3.42%
Mortgage Type
New Conventional
Estimated Equity
$477,702
Purchase Details
Closed on
Nov 8, 2002
Sold by
Advanced Financial Network Inc
Bought by
Cortez Antonio
Home Financials for this Owner
Home Financials are based on the most recent Mortgage that was taken out on this home.
Original Mortgage
$203,801
Interest Rate
6.03%
Mortgage Type
FHA
Purchase Details
Closed on
May 29, 2002
Sold by
Gilbuena Danilo B and Gilbuena Gloria O
Bought by
Advanced Financial Network Inc
Create a Home Valuation Report for This Property
The Home Valuation Report is an in-depth analysis detailing your home's value as well as a comparison with similar homes in the area
Home Values in the Area
Average Home Value in this Area
Purchase History
| Date | Buyer | Sale Price | Title Company |
|---|---|---|---|
| Rodriguez Antonio Cortez | -- | Title 365 | |
| Cortez Antonio | $207,000 | Commonwealth Land Title Co | |
| Advanced Financial Network Inc | -- | -- |
Source: Public Records
Mortgage History
| Date | Status | Borrower | Loan Amount |
|---|---|---|---|
| Open | Rodriguez Antonio Cortez | $197,650 | |
| Closed | Cortez Antonio | $203,801 | |
| Closed | Cortez Antonio | $9,110 |
Source: Public Records
Tax History
| Year | Tax Paid | Tax Assessment Tax Assessment Total Assessment is a certain percentage of the fair market value that is determined by local assessors to be the total taxable value of land and additions on the property. | Land | Improvement |
|---|---|---|---|---|
| 2025 | $4,278 | $299,780 | $238,384 | $61,396 |
| 2024 | $4,278 | $293,903 | $233,710 | $60,193 |
| 2023 | $4,188 | $288,141 | $229,128 | $59,013 |
| 2022 | $3,984 | $282,492 | $224,636 | $57,856 |
| 2021 | $3,935 | $276,954 | $220,232 | $56,722 |
| 2019 | $3,785 | $268,741 | $213,700 | $55,041 |
| 2018 | $3,703 | $263,472 | $209,510 | $53,962 |
| 2016 | $3,567 | $253,242 | $201,375 | $51,867 |
| 2015 | $3,557 | $249,439 | $198,351 | $51,088 |
| 2014 | $3,549 | $244,554 | $194,466 | $50,088 |
Source: Public Records
Map
Nearby Homes
- 624 E Pacific St
- 41 Scottsdale S
- 2 Jackrabbit Ln
- 11 Eastridge Ln
- 40 Camelback Ave S Unit 46
- 23220 Colony Park Dr
- 23616 Panama Ave
- 22960 Mission Dr
- 1526 Lakme Ave
- 618 E 225th St
- 22709 Ravenna Ave
- 22108 Avalon Blvd
- 22729 Marbella Ave
- 143 W 234th Place
- 1611 Bay View Ave
- 212 E 228th St
- 208 W 234th Place
- 1422 E Sandison St
- 22719 Gulf Ave
- 23602 Nicolle Ave
- 830 E Sepulveda Blvd
- 844 E Sepulveda Blvd
- 826 E Sepulveda Blvd
- 837 E Lincoln St
- 841 E Lincoln St
- 833 E Lincoln St
- 846 E Sepulveda Blvd
- 822 E Sepulveda Blvd
- 845 E Lincoln St
- 829 E Lincoln St
- 818 E Sepulveda Blvd
- 850 E Sepulveda Blvd
- 849 E Lincoln St
- 827 E Lincoln St
- 853 E Lincoln St
- 821 E Lincoln St
- 854 E Sepulveda Blvd
- 857 E Lincoln St
- 817 E Lincoln St
- 858 E Sepulveda Blvd
Your Personal Tour Guide
Ask me questions while you tour the home.