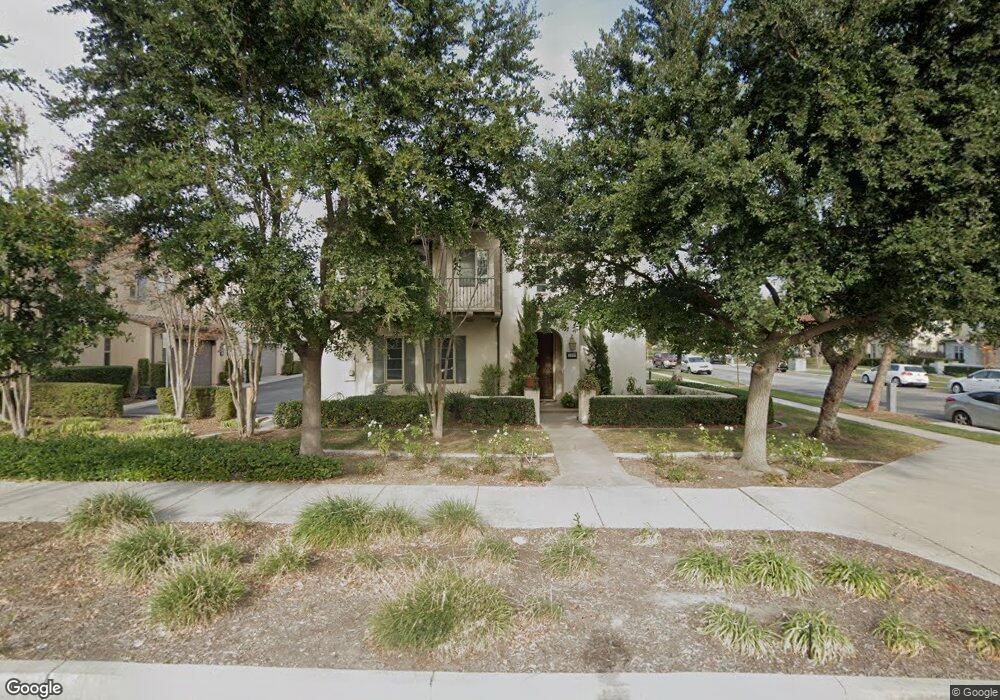
8392 E Preserve Loop Unit 63 Chino, CA 91708
The Preserve NeighborhoodEstimated Value: $571,000 - $663,000
3
Beds
3
Baths
1,552
Sq Ft
$384/Sq Ft
Est. Value
About This Home
This home is located at 8392 E Preserve Loop Unit 63, Chino, CA 91708 and is currently estimated at $596,304, approximately $384 per square foot. 8392 E Preserve Loop Unit 63 is a home located in San Bernardino County with nearby schools including Cal Aero Preserve Academy and Chino Hills High School.
Ownership History
Date
Name
Owned For
Owner Type
Purchase Details
Closed on
Mar 16, 2010
Sold by
Wescom Credit Union
Bought by
Lei Tin I and Tang Wai L
Current Estimated Value
Home Financials for this Owner
Home Financials are based on the most recent Mortgage that was taken out on this home.
Original Mortgage
$204,000
Outstanding Balance
$135,004
Interest Rate
4.95%
Mortgage Type
New Conventional
Estimated Equity
$461,300
Purchase Details
Closed on
Feb 1, 2010
Sold by
Appleman David L
Bought by
Wescom Credit Union
Home Financials for this Owner
Home Financials are based on the most recent Mortgage that was taken out on this home.
Original Mortgage
$204,000
Outstanding Balance
$135,004
Interest Rate
4.95%
Mortgage Type
New Conventional
Estimated Equity
$461,300
Purchase Details
Closed on
Sep 19, 2006
Sold by
Brookfield Preserve Llc
Bought by
Appleman David L
Home Financials for this Owner
Home Financials are based on the most recent Mortgage that was taken out on this home.
Original Mortgage
$487,000
Interest Rate
6.62%
Mortgage Type
Purchase Money Mortgage
Create a Home Valuation Report for This Property
The Home Valuation Report is an in-depth analysis detailing your home's value as well as a comparison with similar homes in the area
Home Values in the Area
Average Home Value in this Area
Purchase History
| Date | Buyer | Sale Price | Title Company |
|---|---|---|---|
| Lei Tin I | $255,000 | Orange Coast Title | |
| Wescom Credit Union | $215,000 | Pacific Coast Title | |
| Appleman David L | $487,500 | Chicago Title Company |
Source: Public Records
Mortgage History
| Date | Status | Borrower | Loan Amount |
|---|---|---|---|
| Open | Lei Tin I | $204,000 | |
| Previous Owner | Appleman David L | $487,000 |
Source: Public Records
Tax History
| Year | Tax Paid | Tax Assessment Tax Assessment Total Assessment is a certain percentage of the fair market value that is determined by local assessors to be the total taxable value of land and additions on the property. | Land | Improvement |
|---|---|---|---|---|
| 2025 | $5,861 | $329,160 | $114,883 | $214,277 |
| 2024 | $5,764 | $322,705 | $112,630 | $210,075 |
| 2023 | $5,666 | $316,378 | $110,422 | $205,956 |
| 2022 | $5,644 | $310,175 | $108,257 | $201,918 |
| 2021 | $5,577 | $304,093 | $106,134 | $197,959 |
| 2020 | $5,533 | $300,975 | $105,046 | $195,929 |
| 2019 | $5,475 | $295,073 | $102,986 | $192,087 |
| 2018 | $5,402 | $289,288 | $100,967 | $188,321 |
| 2017 | $5,345 | $283,615 | $98,987 | $184,628 |
| 2016 | $5,141 | $278,054 | $97,046 | $181,008 |
| 2015 | $5,083 | $273,877 | $95,588 | $178,289 |
| 2014 | $5,026 | $268,513 | $93,716 | $174,797 |
Source: Public Records
Map
Nearby Homes
- 15803 Flight Ave
- 15767 Flight Ave
- 8443 Ranger Ln Unit 116
- 8475 Forest Park St
- 8353 Forest Park St
- 8417 Explorer St
- 8511 Founders Grove St
- 8432 Spirit St
- 15972 Bravery Ave
- 16025 Main St
- 15953 Pilot Ave
- 8257 Spirit St
- 16006 Alamo Ct
- 8243 Spirit St
- 15903 Fountain Ln
- 8119 W Preserve Loop
- 15867 Birdfeeder Ln
- 8706 Founders Grove St
- 15752 Agave Ave Unit 10
- 15736 Agave Ave
- 15750 Lindbergh Ave
- 8382 E Preserve Loop Unit 60
- 8383 Edgewood St
- 8381 Edgewood St Unit 58
- 8381 Edgewood St
- 8372 E Preserve Loop
- 8373 Edgewood St
- 8371 Edgewood St
- 15745 Lindbergh Ave
- 15755 Lindbergh Ave Unit 66
- 15765 Lindbergh Ave
- 8362 E Preserve Loop
- 8363 Edgewood St Unit 53
- 8402 E Preserve Loop
- 8361 Edgewood St
- 8388 Edgewood St
- 8394 Edgewood St
- 8380 Edgewood St Unit 26
- 8381 E Preserve Loop
- 8385 E Preserve Loop Unit 64
Your Personal Tour Guide
Ask me questions while you tour the home.