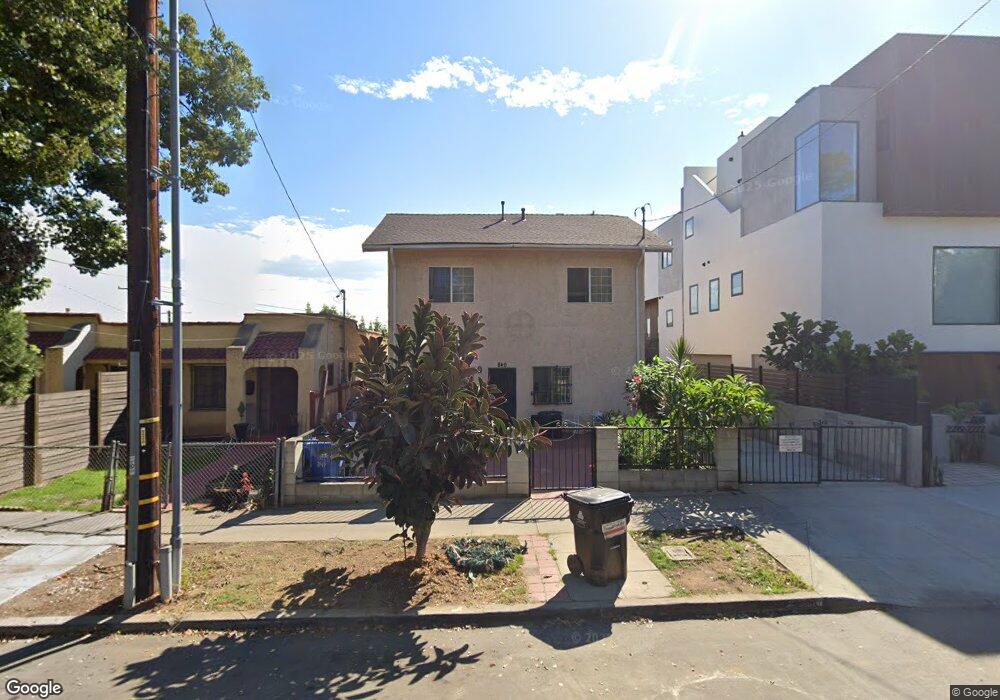
840 Waterloo St Los Angeles, CA 90026
Echo Park NeighborhoodEstimated Value: $1,327,000 - $1,691,000
7
Beds
7
Baths
4,284
Sq Ft
$346/Sq Ft
Est. Value
About This Home
This home is located at 840 Waterloo St, Los Angeles, CA 90026 and is currently estimated at $1,482,240, approximately $345 per square foot. 840 Waterloo St is a home located in Los Angeles County with nearby schools including Virgil Middle School, Belmont High School, and Academic Leadership Community Miguel Contreras Learning Complex.
Ownership History
Date
Name
Owned For
Owner Type
Purchase Details
Closed on
Jan 11, 2020
Sold by
Poblete Eusebio and Poblete Concepcion B
Bought by
Poblete Eusebio and Poblete Concepcion B
Current Estimated Value
Purchase Details
Closed on
Jul 17, 2002
Sold by
One Pac Company
Bought by
Poblete Eusebio P and Poblete Concepcion B
Home Financials for this Owner
Home Financials are based on the most recent Mortgage that was taken out on this home.
Original Mortgage
$297,850
Outstanding Balance
$118,714
Interest Rate
5.87%
Estimated Equity
$1,363,526
Purchase Details
Closed on
Dec 22, 1994
Sold by
Republic Western Insurance Company
Bought by
One Pac Company
Purchase Details
Closed on
Dec 6, 1994
Sold by
Grospe Pablito C and Grospe Rizalina A
Bought by
Republic Western Insurance Company
Create a Home Valuation Report for This Property
The Home Valuation Report is an in-depth analysis detailing your home's value as well as a comparison with similar homes in the area
Home Values in the Area
Average Home Value in this Area
Purchase History
| Date | Buyer | Sale Price | Title Company |
|---|---|---|---|
| Poblete Eusebio | -- | None Available | |
| Poblete Eusebio P | $425,500 | Equity Title Company | |
| One Pac Company | -- | -- | |
| Republic Western Insurance Company | $210,000 | Chicago Title Insurance Co |
Source: Public Records
Mortgage History
| Date | Status | Borrower | Loan Amount |
|---|---|---|---|
| Open | Poblete Eusebio P | $297,850 |
Source: Public Records
Tax History Compared to Growth
Tax History
| Year | Tax Paid | Tax Assessment Tax Assessment Total Assessment is a certain percentage of the fair market value that is determined by local assessors to be the total taxable value of land and additions on the property. | Land | Improvement |
|---|---|---|---|---|
| 2025 | $7,824 | $616,247 | $289,656 | $326,591 |
| 2024 | $7,824 | $604,165 | $283,977 | $320,188 |
| 2023 | $7,680 | $592,319 | $278,409 | $313,910 |
| 2022 | $7,335 | $580,705 | $272,950 | $307,755 |
| 2021 | $7,225 | $569,320 | $267,599 | $301,721 |
| 2020 | $7,291 | $563,484 | $264,856 | $298,628 |
| 2019 | $7,016 | $552,436 | $259,663 | $292,773 |
| 2018 | $6,899 | $541,605 | $254,572 | $287,033 |
| 2016 | $6,558 | $520,576 | $244,688 | $275,888 |
| 2015 | $6,466 | $512,757 | $241,013 | $271,744 |
| 2014 | $6,503 | $502,713 | $236,292 | $266,421 |
Source: Public Records
Map
Nearby Homes
- 901 Rosemont Ave
- 1037 Waterloo St
- 720 Waterloo St Unit 4
- 1114 Coronado Terrace
- 444 N Coronado St
- 1922 Santa Ynez St
- 2506 W Sunset Blvd
- 627 Coronado Terrace
- 616 N Alvarado St
- 2300 Bellevue Ave
- 851 N Rampart Blvd
- 1315 Coronado Terrace
- 1741 Kent St
- 2007 Bellevue Ave
- 2005 Bellevue Ave
- 1342 Mohawk St
- 608 N Rampart Blvd
- 921 N Benton Way
- 606 N Bonnie Brae St
- 1402 Allesandro St
- 844 Waterloo St
- 836 Waterloo St
- 2219 W Starview Ln
- 2219 Starview Ln
- 2119 Starview Ln
- 848 Waterloo St
- 832 Waterloo St
- 2216 Marathon St
- 852 Waterloo St
- 826 Waterloo St Unit 1/2
- 826 Waterloo St
- 909 Rosemont Ave
- 905 Rosemont Ave
- 915 Rosemont Ave
- 917 Rosemont Ave
- 822 Waterloo St
- 843 Waterloo St
- 845 Waterloo St
- 837 Waterloo St
- 2200 Marathon St