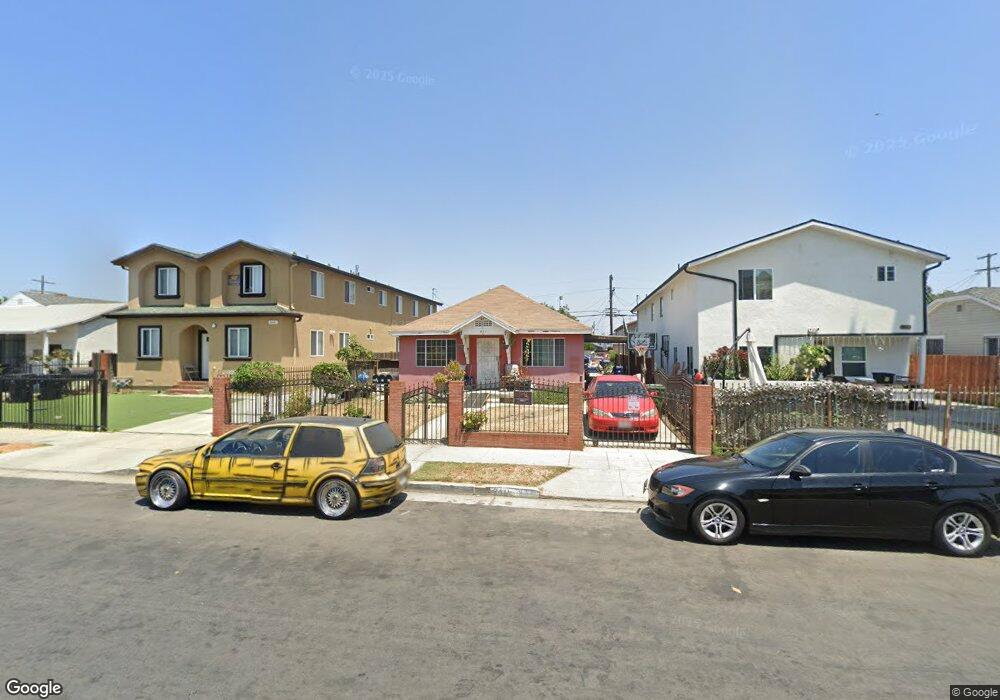
841 W 77th St Los Angeles, CA 90044
Vermont Knolls NeighborhoodEstimated Value: $730,000 - $824,000
5
Beds
3
Baths
2,092
Sq Ft
$370/Sq Ft
Est. Value
About This Home
This home is located at 841 W 77th St, Los Angeles, CA 90044 and is currently estimated at $774,333, approximately $370 per square foot. 841 W 77th St is a home located in Los Angeles County with nearby schools including Loren Miller Elementary School, Mary McLeod Bethune Middle School, and Academy For Multiligual Arts And Science At Mervyn M. Dymally High.
Ownership History
Date
Name
Owned For
Owner Type
Purchase Details
Closed on
Jun 15, 2009
Sold by
Hsbc Bank Usa Na
Bought by
Alvarez Juan M and Alvarez Maria
Current Estimated Value
Home Financials for this Owner
Home Financials are based on the most recent Mortgage that was taken out on this home.
Original Mortgage
$147,000
Interest Rate
5.3%
Mortgage Type
Purchase Money Mortgage
Purchase Details
Closed on
Sep 10, 2008
Sold by
Truss Eraina L
Bought by
Hsbc Bank Usa Na
Purchase Details
Closed on
Nov 5, 2001
Sold by
Harris Flora B
Bought by
Truss Eraina L and Harris Flora B
Purchase Details
Closed on
May 17, 1999
Sold by
Harris Flora B
Bought by
Harris Flora B and Truss Eraina L
Purchase Details
Closed on
May 11, 1994
Sold by
Harris Flora B
Bought by
Harris Flora B
Home Financials for this Owner
Home Financials are based on the most recent Mortgage that was taken out on this home.
Original Mortgage
$50,000
Interest Rate
8.3%
Create a Home Valuation Report for This Property
The Home Valuation Report is an in-depth analysis detailing your home's value as well as a comparison with similar homes in the area
Home Values in the Area
Average Home Value in this Area
Purchase History
| Date | Buyer | Sale Price | Title Company |
|---|---|---|---|
| Alvarez Juan M | $238,500 | Lsi Title Fnds Division | |
| Hsbc Bank Usa Na | $1,000 | None Available | |
| Truss Eraina L | -- | -- | |
| Harris Flora B | -- | -- | |
| Harris Flora B | -- | Progressive Title Company |
Source: Public Records
Mortgage History
| Date | Status | Borrower | Loan Amount |
|---|---|---|---|
| Previous Owner | Alvarez Juan M | $147,000 | |
| Previous Owner | Harris Flora B | $50,000 |
Source: Public Records
Tax History Compared to Growth
Tax History
| Year | Tax Paid | Tax Assessment Tax Assessment Total Assessment is a certain percentage of the fair market value that is determined by local assessors to be the total taxable value of land and additions on the property. | Land | Improvement |
|---|---|---|---|---|
| 2025 | $3,941 | $307,844 | $178,771 | $129,073 |
| 2024 | $3,941 | $301,809 | $175,266 | $126,543 |
| 2023 | $3,873 | $295,892 | $171,830 | $124,062 |
| 2022 | $3,705 | $290,091 | $168,461 | $121,630 |
| 2021 | $3,647 | $284,404 | $165,158 | $119,246 |
| 2020 | $3,679 | $281,989 | $163,465 | $118,524 |
| 2019 | $3,543 | $276,470 | $160,260 | $116,210 |
| 2018 | $3,450 | $271,060 | $157,118 | $113,942 |
| 2016 | $3,283 | $260,056 | $151,018 | $109,038 |
| 2015 | $3,237 | $256,151 | $148,750 | $107,401 |
| 2014 | $3,267 | $251,135 | $145,837 | $105,298 |
Source: Public Records
Map
Nearby Homes