8426 Rocklin Way Redding, CA 96001
Centerville NeighborhoodEstimated Value: $385,443 - $421,000
3
Beds
2
Baths
1,680
Sq Ft
$240/Sq Ft
Est. Value
About This Home
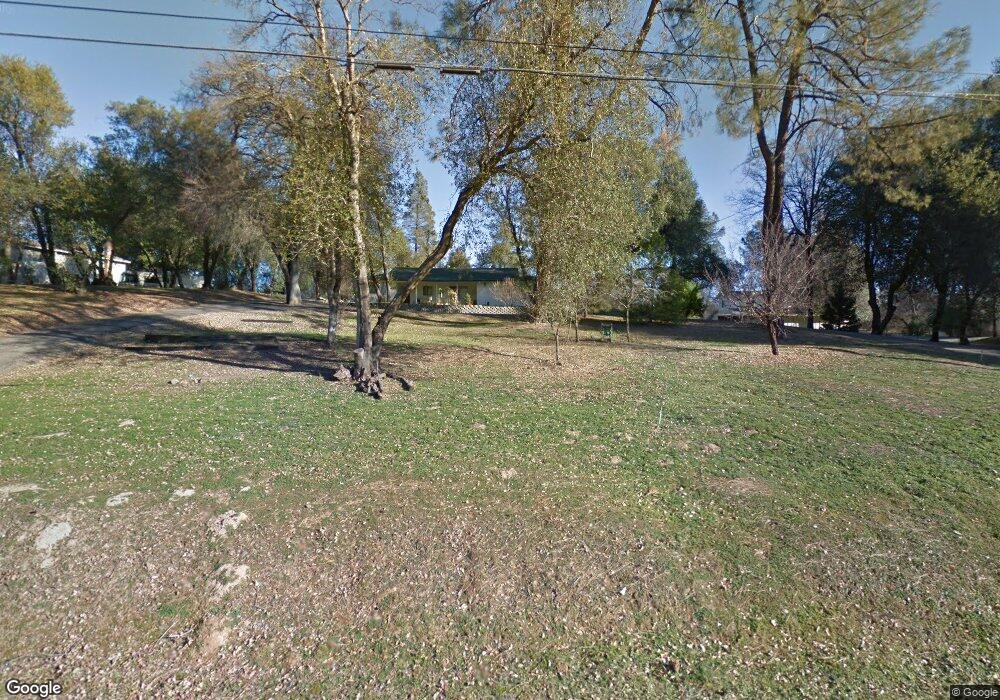
This home is located at 8426 Rocklin Way, Redding, CA 96001 and is currently estimated at $403,111, approximately $239 per square foot. 8426 Rocklin Way is a home located in Shasta County with nearby schools including Grant Elementary School and Shasta High School.
Ownership History
Date
Name
Owned For
Owner Type
Purchase Details
Closed on
Apr 1, 2020
Sold by
Carroll April Dawn
Bought by
Carroll April D
Current Estimated Value
Purchase Details
Closed on
May 19, 2017
Sold by
Carroll Thomas P
Bought by
Carroll April D
Purchase Details
Closed on
Apr 6, 2015
Sold by
Carroll Thomas P
Bought by
Carroll April D
Home Financials for this Owner
Home Financials are based on the most recent Mortgage that was taken out on this home.
Original Mortgage
$142,000
Interest Rate
3.73%
Mortgage Type
New Conventional
Purchase Details
Closed on
Oct 17, 2011
Sold by
Carroll Thomas P and Carroll April D
Bought by
Carroll Thomas P and Carroll April Dawn
Home Financials for this Owner
Home Financials are based on the most recent Mortgage that was taken out on this home.
Original Mortgage
$172,500
Interest Rate
4.05%
Mortgage Type
New Conventional
Create a Home Valuation Report for This Property
The Home Valuation Report is an in-depth analysis detailing your home's value as well as a comparison with similar homes in the area
Home Values in the Area
Average Home Value in this Area
Purchase History
| Date | Buyer | Sale Price | Title Company |
|---|---|---|---|
| Carroll April D | -- | None Available | |
| Carroll April D | -- | None Available | |
| Carroll April D | -- | Placer Title Company | |
| Carroll Thomas P | -- | Placer Title Company |
Source: Public Records
Mortgage History
| Date | Status | Borrower | Loan Amount |
|---|---|---|---|
| Closed | Carroll April D | $142,000 | |
| Closed | Carroll Thomas P | $172,500 |
Source: Public Records
Tax History
| Year | Tax Paid | Tax Assessment Tax Assessment Total Assessment is a certain percentage of the fair market value that is determined by local assessors to be the total taxable value of land and additions on the property. | Land | Improvement |
|---|---|---|---|---|
| 2025 | $2,321 | $221,765 | $67,966 | $153,799 |
| 2024 | $2,280 | $217,418 | $66,634 | $150,784 |
| 2023 | $2,280 | $213,156 | $65,328 | $147,828 |
| 2022 | $2,221 | $208,978 | $64,048 | $144,930 |
| 2021 | $2,175 | $204,882 | $62,793 | $142,089 |
| 2020 | $2,272 | $202,783 | $62,150 | $140,633 |
| 2019 | $2,172 | $198,808 | $60,932 | $137,876 |
| 2018 | $2,286 | $194,911 | $59,738 | $135,173 |
| 2017 | $2,104 | $191,090 | $58,567 | $132,523 |
| 2016 | $2,050 | $187,344 | $57,419 | $129,925 |
| 2015 | $2,019 | $184,531 | $56,557 | $127,974 |
| 2014 | -- | $180,918 | $55,450 | $125,468 |
Source: Public Records
Map
Nearby Homes
- 8566 Placer Rd
- 15725 Horseless Carriage Dr
- 15745 Montgomery Ranch Rd
- 15624 Ranchland Dr
- 8751 Goldstone Ln
- 16160 Plateau Cir
- 8846 Goldstone Ln
- 15799 Nauvoo Trail
- 8658 Knobhill Cir
- 8947 Olney Park Dr
- 034 Soleado Ln
- 033 Soleado Ln
- 8664 Landmark Cir
- 15333 Mountain Shadows Dr
- 15900 El Camino Robles Rd
- 8003 Narrows Way
- 15888 El Camino Robles Rd
- 0 El Camino Robles Rd
- 15189 Mountain Shadows Dr
- 15223 Ledgewood Dr
- 8440 Rocklin Way
- 8404 Rocklin Way
- 8476 Rocklin Way
- 0 Old Happy Valley Rd Unit 17-3153
- 0 Old Happy Valley Rd Unit 1-89020
- 0 Old Happy Valley Rd Unit 85474
- 0 Old Happy Valley Rd Unit 86871
- 0 Old Happy Valley Rd Unit 20220588
- 8409 Creekview Ln
- 8414 Creekview Ln
- 15901 Tadpole Creek Ln
- 8392 Rocklin Way
- 8463 Rocklin Way
- 15947 Melinda Way
- 8479 Rocklin Way
- 16001 Yankee Mine Rd
- 8406 Creekview Ln Unit 1
- 8406 Creekview Ln
- 15965 Yankee Mine Rd
- 15937 Melinda Way
Your Personal Tour Guide
Ask me questions while you tour the home.