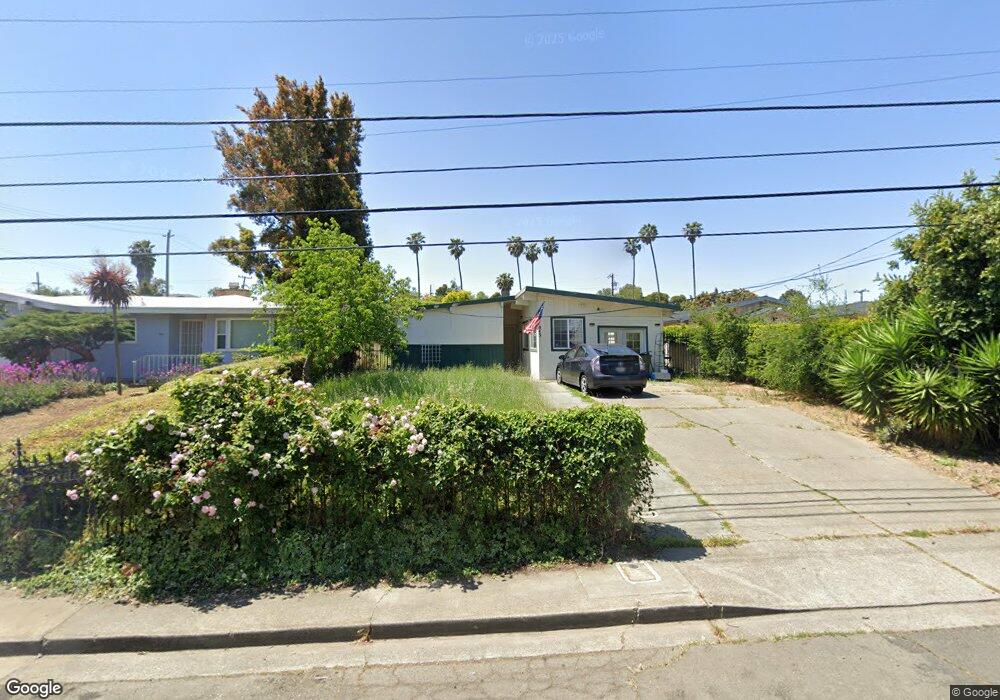
843 5th St Vallejo, CA 94590
South Vallejo NeighborhoodEstimated Value: $438,740 - $480,000
4
Beds
2
Baths
1,320
Sq Ft
$345/Sq Ft
Est. Value
About This Home
This home is located at 843 5th St, Vallejo, CA 94590 and is currently estimated at $455,185, approximately $344 per square foot. 843 5th St is a home located in Solano County with nearby schools including Grace Patterson Elementary School, Vallejo High School, and Mustard Seed Preschool and Kindergarten.
Ownership History
Date
Name
Owned For
Owner Type
Purchase Details
Closed on
Mar 12, 2018
Sold by
Stark Raymond K
Bought by
Stark Raymond K and Stark Sharon A
Current Estimated Value
Purchase Details
Closed on
Dec 14, 2017
Sold by
Stark Ray
Bought by
Stark Raymond K and Stark Sharon A
Purchase Details
Closed on
Jan 29, 2002
Sold by
Stark Sharon A
Bought by
Stark Ray
Home Financials for this Owner
Home Financials are based on the most recent Mortgage that was taken out on this home.
Original Mortgage
$171,900
Outstanding Balance
$73,283
Interest Rate
7.5%
Estimated Equity
$381,902
Purchase Details
Closed on
Jan 24, 2002
Sold by
Rios Jose Macias and Macias Elodia C
Bought by
Stark Ray
Home Financials for this Owner
Home Financials are based on the most recent Mortgage that was taken out on this home.
Original Mortgage
$171,900
Outstanding Balance
$73,283
Interest Rate
7.5%
Estimated Equity
$381,902
Create a Home Valuation Report for This Property
The Home Valuation Report is an in-depth analysis detailing your home's value as well as a comparison with similar homes in the area
Home Values in the Area
Average Home Value in this Area
Purchase History
| Date | Buyer | Sale Price | Title Company |
|---|---|---|---|
| Stark Raymond K | -- | None Available | |
| Stark Raymond K | -- | None Available | |
| Stark Ray | -- | Chicago Title Co | |
| Stark Ray | $215,000 | Chicago Title Co |
Source: Public Records
Mortgage History
| Date | Status | Borrower | Loan Amount |
|---|---|---|---|
| Open | Stark Ray | $171,900 | |
| Closed | Stark Ray | $21,450 |
Source: Public Records
Tax History
| Year | Tax Paid | Tax Assessment Tax Assessment Total Assessment is a certain percentage of the fair market value that is determined by local assessors to be the total taxable value of land and additions on the property. | Land | Improvement |
|---|---|---|---|---|
| 2025 | $5,978 | $317,460 | $73,856 | $243,604 |
| 2024 | $5,978 | $311,236 | $72,408 | $238,828 |
| 2023 | $5,629 | $305,135 | $70,989 | $234,146 |
| 2022 | $5,438 | $299,153 | $69,599 | $229,554 |
| 2021 | $4,201 | $293,288 | $68,235 | $225,053 |
| 2020 | $5,308 | $290,282 | $67,536 | $222,746 |
| 2019 | $5,150 | $284,591 | $66,212 | $218,379 |
| 2018 | $5,346 | $279,012 | $64,914 | $214,098 |
| 2017 | $5,493 | $273,542 | $63,642 | $209,900 |
| 2016 | $4,736 | $251,000 | $52,000 | $199,000 |
| 2015 | $4,391 | $224,000 | $49,000 | $175,000 |
| 2014 | $4,094 | $203,000 | $45,000 | $158,000 |
Source: Public Records
Map
Nearby Homes
- 816 Grant St
- 644 Porter St
- 1012 Pine St
- 121 Lincoln Rd W
- 314 San Marcus Dr
- 615 Mclane St
- 414 Mclane St
- 412 Mclane St
- 410 San Gabriel Dr Unit 410
- 435 Grant St
- 199 Sandy Beach Rd
- 225 Gary Cir
- 105 Laguna St
- 219 Sea Crest Cir
- 173 Jordan St
- 246 Jordan St
- 9 Sandy Beach Rd
- 108 Mesa St
- 24 Constance Dr
- 175 Frieda Cir
Your Personal Tour Guide
Ask me questions while you tour the home.