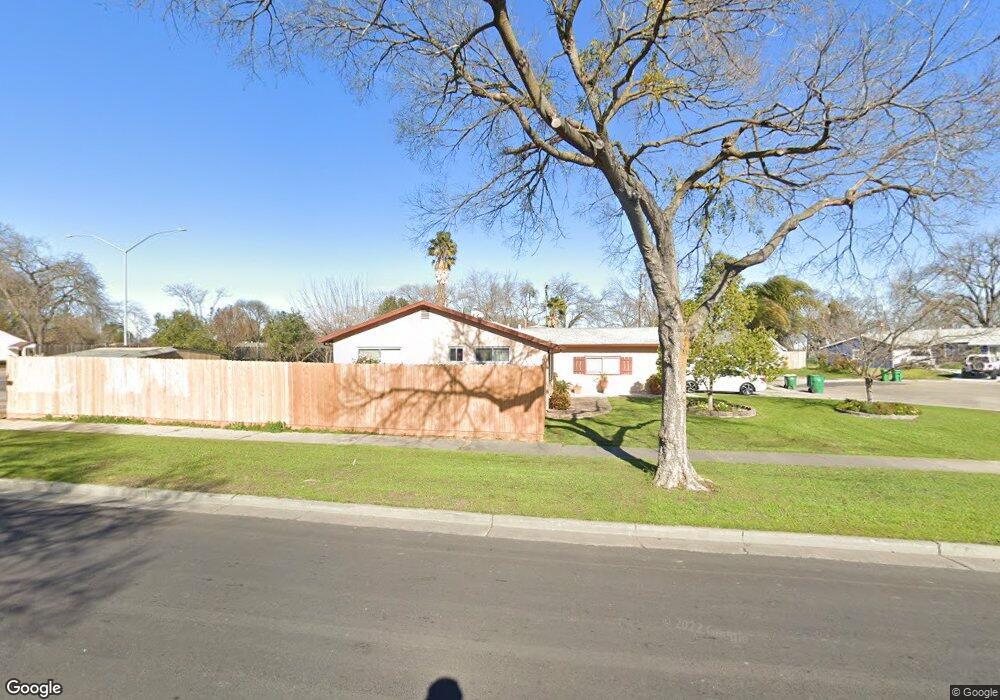
843 Morada A Ct Stockton, CA 95210
Bear Creek East NeighborhoodEstimated Value: $251,000 - $386,641
3
Beds
2
Baths
1,278
Sq Ft
$256/Sq Ft
Est. Value
About This Home
This home is located at 843 Morada A Ct, Stockton, CA 95210 and is currently estimated at $327,410, approximately $256 per square foot. 843 Morada A Ct is a home located in San Joaquin County with nearby schools including Kennedy Elementary School, Pulliam Elementary School, and Adams Elementary School.
Ownership History
Date
Name
Owned For
Owner Type
Purchase Details
Closed on
Nov 17, 2003
Sold by
Wimberly Bernice
Bought by
Bautista Javier E and Bautista Patricia
Current Estimated Value
Home Financials for this Owner
Home Financials are based on the most recent Mortgage that was taken out on this home.
Original Mortgage
$196,910
Outstanding Balance
$91,288
Interest Rate
6%
Mortgage Type
Purchase Money Mortgage
Estimated Equity
$236,122
Purchase Details
Closed on
Jul 14, 1998
Sold by
Wimberly Bernice and Dasanmartino Bernice A
Bought by
Wimberly Bernice
Home Financials for this Owner
Home Financials are based on the most recent Mortgage that was taken out on this home.
Original Mortgage
$52,000
Interest Rate
7.01%
Purchase Details
Closed on
May 23, 1994
Sold by
Wimberly Lorraine F
Bought by
Wimberly Lorraine F and Dasanmartino Bernice A
Create a Home Valuation Report for This Property
The Home Valuation Report is an in-depth analysis detailing your home's value as well as a comparison with similar homes in the area
Home Values in the Area
Average Home Value in this Area
Purchase History
| Date | Buyer | Sale Price | Title Company |
|---|---|---|---|
| Bautista Javier E | $203,000 | Alliance Title Co | |
| Wimberly Bernice | -- | First American Title Co | |
| Wimberly Lorraine F | -- | -- |
Source: Public Records
Mortgage History
| Date | Status | Borrower | Loan Amount |
|---|---|---|---|
| Open | Bautista Javier E | $196,910 | |
| Previous Owner | Wimberly Bernice | $52,000 |
Source: Public Records
Tax History Compared to Growth
Tax History
| Year | Tax Paid | Tax Assessment Tax Assessment Total Assessment is a certain percentage of the fair market value that is determined by local assessors to be the total taxable value of land and additions on the property. | Land | Improvement |
|---|---|---|---|---|
| 2025 | $3,463 | $288,606 | $85,301 | $203,305 |
| 2024 | $3,407 | $282,948 | $83,629 | $199,319 |
| 2023 | $3,329 | $277,401 | $81,990 | $195,411 |
| 2022 | $3,301 | $271,963 | $80,383 | $191,580 |
| 2021 | $3,171 | $266,631 | $78,807 | $187,824 |
| 2020 | $3,232 | $263,898 | $77,999 | $185,899 |
| 2019 | $3,217 | $258,724 | $76,470 | $182,254 |
| 2018 | $3,156 | $253,652 | $74,971 | $178,681 |
| 2017 | $2,343 | $196,000 | $58,000 | $138,000 |
| 2016 | $2,027 | $164,000 | $48,000 | $116,000 |
| 2014 | $1,533 | $127,000 | $38,000 | $89,000 |
Source: Public Records
Map
Nearby Homes
- 1017 Royal Oaks Dr
- 1020 Oakleaf Way
- 916 Springoak Way
- 9221 N El Dorado St
- 8715 Eastwood Ct
- 8824 N El Dorado St
- 214 Don Carlos Ave
- 1418 Woodcreek Way
- 8603 Acapulco Way
- 9511 Theresa Cir
- 1235 Briarwood Way
- 764 Macduff Ave
- 948 Macduff Ave
- 8518 Burns Place
- 1626 Navajo Dr
- 8419 Macduff Ct
- 8811 Davis Rd
- 9418 Shawnee Ct
- 9431 Shawnee Ct
- 302 Sepulveda Dr
- 841 Morada A Ct
- 9247 Santa Maria Way
- 12895 N Lower Sacramento Rd
- 833 Morada A Ct
- 837 Morada A Ct
- 835 Morada A Ct
- 9241 Santa Maria Way
- 9371 Lower Sacramento Rd
- 828 Morada Ln
- 819 Morada B Ct
- 817 Morada B Ct
- 9252 Valley Oak Dr
- 9235 Santa Maria Way
- 837 Junipero Serra Dr
- 822 Morada Ln
- 831 Junipero Serra Dr
- 9240 Valley Oak Dr
- 815 Morada B Ct
- 907 Bear Creek Way
- 9229 Santa Maria Way