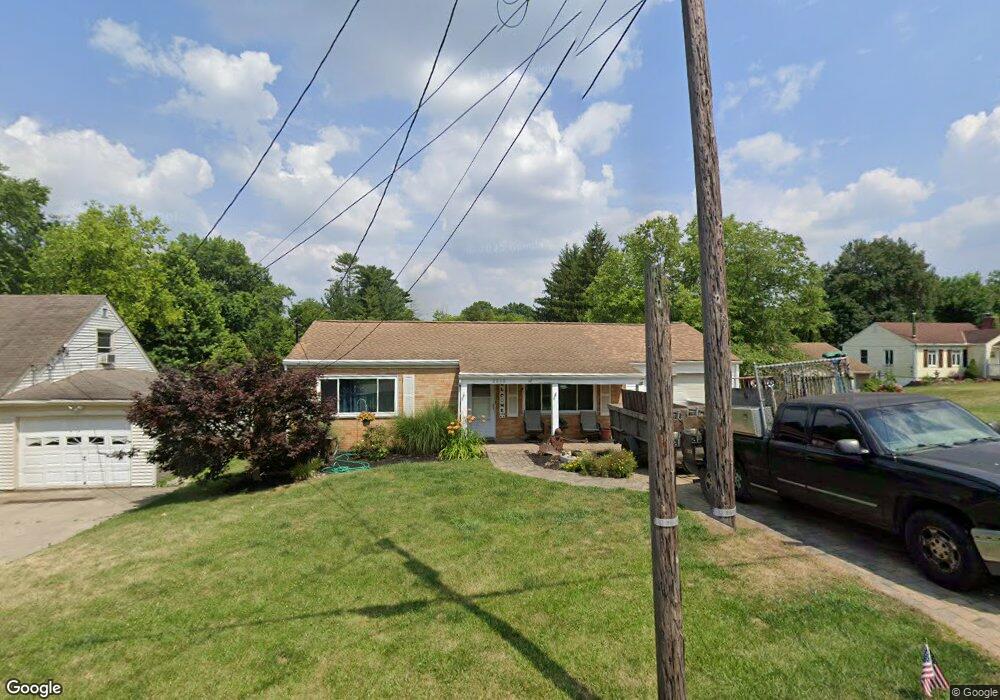
8438 Wuest Rd Cincinnati, OH 45247
Estimated Value: $195,000 - $232,000
3
Beds
1
Bath
1,350
Sq Ft
$162/Sq Ft
Est. Value
About This Home
This home is located at 8438 Wuest Rd, Cincinnati, OH 45247 and is currently estimated at $218,475, approximately $161 per square foot. 8438 Wuest Rd is a home located in Hamilton County with nearby schools including Colerain Elementary School, Colerain Middle School, and Colerain High School.
Ownership History
Date
Name
Owned For
Owner Type
Purchase Details
Closed on
Jan 25, 2010
Sold by
Gross Joseph
Bought by
Veneman Mark C
Current Estimated Value
Home Financials for this Owner
Home Financials are based on the most recent Mortgage that was taken out on this home.
Original Mortgage
$81,000
Interest Rate
5%
Mortgage Type
Unknown
Purchase Details
Closed on
Jan 22, 2010
Sold by
Funk James B and Glankler Kristina M
Bought by
Gross Joseph
Home Financials for this Owner
Home Financials are based on the most recent Mortgage that was taken out on this home.
Original Mortgage
$81,000
Interest Rate
5%
Mortgage Type
Unknown
Purchase Details
Closed on
Jun 7, 1999
Sold by
West Michael T and West Jennifer M
Bought by
Funk James B and Glankler Kristina M
Home Financials for this Owner
Home Financials are based on the most recent Mortgage that was taken out on this home.
Original Mortgage
$77,600
Interest Rate
6.5%
Create a Home Valuation Report for This Property
The Home Valuation Report is an in-depth analysis detailing your home's value as well as a comparison with similar homes in the area
Home Values in the Area
Average Home Value in this Area
Purchase History
| Date | Buyer | Sale Price | Title Company |
|---|---|---|---|
| Veneman Mark C | $79,000 | Imperial Title Services Llc | |
| Gross Joseph | $50,000 | Attorney | |
| Funk James B | $97,000 | -- |
Source: Public Records
Mortgage History
| Date | Status | Borrower | Loan Amount |
|---|---|---|---|
| Closed | Veneman Mark C | $81,000 | |
| Previous Owner | Funk James B | $77,600 |
Source: Public Records
Tax History Compared to Growth
Tax History
| Year | Tax Paid | Tax Assessment Tax Assessment Total Assessment is a certain percentage of the fair market value that is determined by local assessors to be the total taxable value of land and additions on the property. | Land | Improvement |
|---|---|---|---|---|
| 2024 | $3,023 | $56,504 | $13,657 | $42,847 |
| 2023 | $2,859 | $53,088 | $13,657 | $39,431 |
| 2022 | $2,697 | $40,856 | $12,894 | $27,962 |
| 2021 | $2,674 | $40,856 | $12,894 | $27,962 |
| 2020 | $2,702 | $40,856 | $12,894 | $27,962 |
| 2019 | $2,455 | $33,152 | $10,927 | $22,225 |
| 2018 | $2,110 | $33,152 | $10,927 | $22,225 |
| 2017 | $1,999 | $33,152 | $10,927 | $22,225 |
| 2016 | $1,608 | $26,268 | $11,057 | $15,211 |
| 2015 | $1,623 | $26,268 | $11,057 | $15,211 |
| 2014 | $1,626 | $26,268 | $11,057 | $15,211 |
| 2013 | $1,629 | $27,651 | $11,638 | $16,013 |
Source: Public Records
Map
Nearby Homes
- 8530 Wuest Rd
- 3663 Sandralin Dr
- 3950 Olde Savannah Dr
- 3937 Olde Savannah Dr Unit 3937
- 3960 Olde Savannah Dr
- 3701 W Galbraith Rd
- 3691 W Galbraith Rd
- 8747 Cheviot Rd
- 3474 Oakmeadow Ln
- 8323 Firshade Terrace
- 8344 Firshade Terrace
- 4893 Blue Meadow Ln
- 3927 Philnoll Dr
- 8812 Carrousel Park Cir
- 3971 Woodsong Dr
- 3464 Nandale Dr Unit 53
- 3408 Rocker Dr
- 9160 Cobblechase Ct
- 3889 Brockton Dr
- 9136 Yellowwood Dr