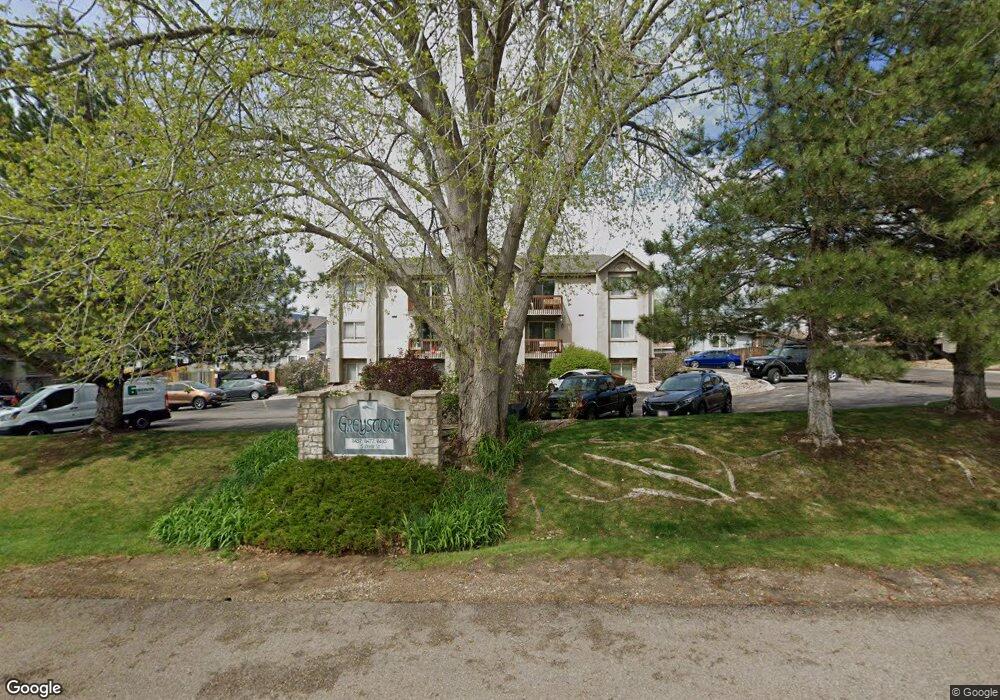
8477 S Reed St Unit 2302 Littleton, CO 80128
Cay at Marina Pointe NeighborhoodEstimated Value: $287,869 - $314,000
2
Beds
1
Bath
970
Sq Ft
$310/Sq Ft
Est. Value
About This Home
This home is located at 8477 S Reed St Unit 2302, Littleton, CO 80128 and is currently estimated at $300,217, approximately $309 per square foot. 8477 S Reed St Unit 2302 is a home located in Jefferson County with nearby schools including Columbine Hills Elementary School, Ken Caryl Middle School, and Columbine High School.
Ownership History
Date
Name
Owned For
Owner Type
Purchase Details
Closed on
Aug 25, 2025
Sold by
Ross Gene A and Ross Yvonne B
Bought by
Richard Robert Kirby and Magill Peter
Current Estimated Value
Home Financials for this Owner
Home Financials are based on the most recent Mortgage that was taken out on this home.
Original Mortgage
$146,250
Outstanding Balance
$146,250
Interest Rate
6.75%
Mortgage Type
New Conventional
Estimated Equity
$153,967
Purchase Details
Closed on
Jul 4, 2015
Sold by
Ross Stephanie C and Konadu Stephanie C
Bought by
Ross Gene A and Ross Yvonne B
Purchase Details
Closed on
Jan 30, 2004
Sold by
Hallmark Enterprises Llc
Bought by
Ross Stephanie C and Ross Gene A
Home Financials for this Owner
Home Financials are based on the most recent Mortgage that was taken out on this home.
Original Mortgage
$129,800
Interest Rate
5.78%
Mortgage Type
FHA
Create a Home Valuation Report for This Property
The Home Valuation Report is an in-depth analysis detailing your home's value as well as a comparison with similar homes in the area
Home Values in the Area
Average Home Value in this Area
Purchase History
| Date | Buyer | Sale Price | Title Company |
|---|---|---|---|
| Richard Robert Kirby | $195,000 | Land Title Guarantee | |
| Ross Gene A | -- | None Available | |
| Ross Stephanie C | $136,900 | -- |
Source: Public Records
Mortgage History
| Date | Status | Borrower | Loan Amount |
|---|---|---|---|
| Open | Richard Robert Kirby | $146,250 | |
| Previous Owner | Ross Stephanie C | $129,800 |
Source: Public Records
Tax History Compared to Growth
Tax History
| Year | Tax Paid | Tax Assessment Tax Assessment Total Assessment is a certain percentage of the fair market value that is determined by local assessors to be the total taxable value of land and additions on the property. | Land | Improvement |
|---|---|---|---|---|
| 2024 | $1,708 | $18,212 | -- | $18,212 |
| 2023 | $1,708 | $18,212 | $0 | $18,212 |
| 2022 | $1,787 | $17,695 | $0 | $17,695 |
| 2021 | $1,812 | $18,204 | $0 | $18,204 |
| 2020 | $1,776 | $17,925 | $0 | $17,925 |
| 2019 | $1,763 | $17,925 | $0 | $17,925 |
| 2018 | $1,366 | $13,937 | $0 | $13,937 |
| 2017 | $1,331 | $13,937 | $0 | $13,937 |
| 2016 | $1,059 | $10,723 | $1 | $10,722 |
| 2015 | -- | $10,723 | $1 | $10,722 |
| 2014 | $702 | $6,640 | $1 | $6,639 |
Source: Public Records
Map
Nearby Homes
- 8457 S Reed St Unit 1202
- 6995 W Payne Ave
- 8536 S Upham Way
- 8468 S Upham Way
- 6811 W Remington Place
- 8346 S Reed St
- 8547 S Upham Way
- 8378 S Upham Way Unit B-305
- 8422 S Upham Way Unit G60
- 8321 S Upham Way Unit 2208
- 8337 S Upham Way Unit 209
- 8311 S Upham Way
- 8331 S Upham Way Unit 106
- 8361 S Upham Way Unit 209
- 8371 S Upham Way Unit 208
- 7667 W Brook Dr
- 8595 S Yarrow St
- 7415 W Clifton Ave
- 7740 W Phillips Ave
- 7690 W Massey Dr
- 8477 S Reed St Unit 2301
- 8477 S Reed St Unit 2202
- 8477 S Reed St Unit 2201
- 8477 S Reed St Unit 2102
- 8477 S Reed St Unit 2101
- 8477 S Reed St Unit 2-10
- 8488 S Saulsbury St
- 8478 S Saulsbury St
- 8495 S Reed St Unit 3302
- 8495 S Reed St Unit 3301
- 8495 S Reed St Unit 3202
- 8495 S Reed St Unit 3102
- 8495 S Reed St
- 8495 S Reed St Unit 202
- 8495 S Reed St Unit 301
- 8498 S Saulsbury St
- 8457 S Reed St Unit 1302
- 8457 S Reed St Unit 1301
- 8457 S Reed St Unit 1201
- 8457 S Reed St Unit 1102