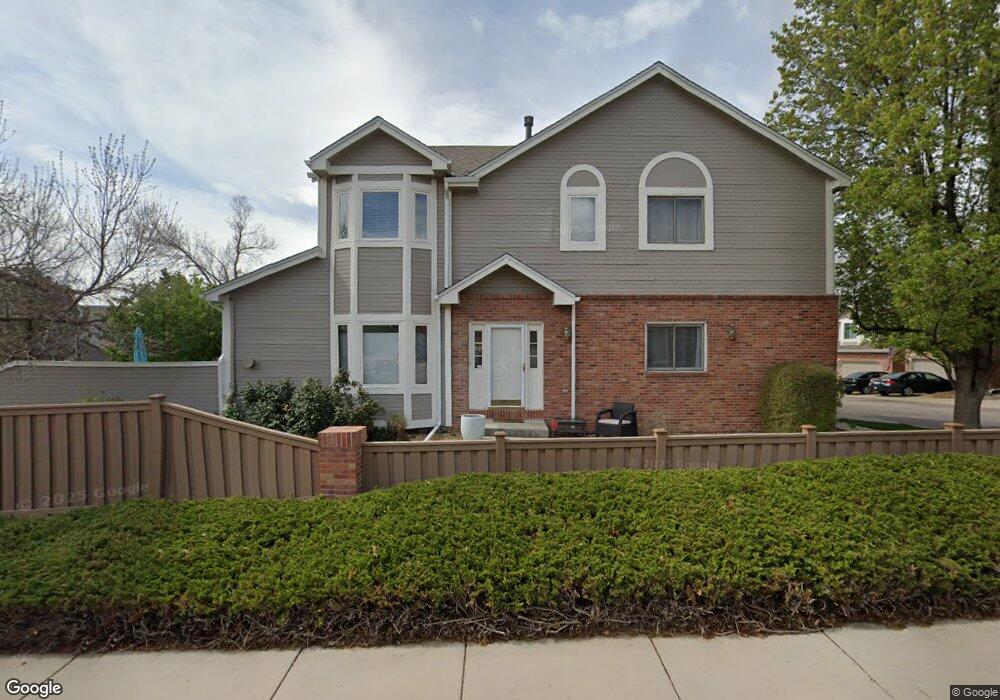
8487 S Upham Way Littleton, CO 80128
Cay at Marina Pointe NeighborhoodEstimated Value: $489,000 - $565,000
3
Beds
4
Baths
2,405
Sq Ft
$218/Sq Ft
Est. Value
About This Home
This home is located at 8487 S Upham Way, Littleton, CO 80128 and is currently estimated at $523,351, approximately $217 per square foot. 8487 S Upham Way is a home located in Jefferson County with nearby schools including Columbine Hills Elementary School, Ken Caryl Middle School, and Columbine High School.
Ownership History
Date
Name
Owned For
Owner Type
Purchase Details
Closed on
Apr 16, 2010
Sold by
Bruce John R
Bought by
Knoll Jordan
Current Estimated Value
Home Financials for this Owner
Home Financials are based on the most recent Mortgage that was taken out on this home.
Original Mortgage
$235,824
Outstanding Balance
$155,109
Interest Rate
4.75%
Mortgage Type
FHA
Estimated Equity
$368,242
Purchase Details
Closed on
Dec 17, 2001
Sold by
Bower Donn A
Bought by
Bruce John R
Home Financials for this Owner
Home Financials are based on the most recent Mortgage that was taken out on this home.
Original Mortgage
$176,800
Interest Rate
6.39%
Purchase Details
Closed on
Nov 30, 1999
Sold by
Whytock Ronny E Whytock Catherine M
Bought by
Bower Donn A
Home Financials for this Owner
Home Financials are based on the most recent Mortgage that was taken out on this home.
Original Mortgage
$147,120
Interest Rate
7.95%
Purchase Details
Closed on
Aug 15, 1995
Sold by
Vision Homes Inc
Bought by
Whytock Ronny E and Whytock Catherine M
Create a Home Valuation Report for This Property
The Home Valuation Report is an in-depth analysis detailing your home's value as well as a comparison with similar homes in the area
Home Values in the Area
Average Home Value in this Area
Purchase History
| Date | Buyer | Sale Price | Title Company |
|---|---|---|---|
| Knoll Jordan | $239,000 | Fidelity National Title Insu | |
| Bruce John R | $221,000 | Title Services | |
| Bower Donn A | $183,900 | -- | |
| Whytock Ronny E | $165,182 | -- |
Source: Public Records
Mortgage History
| Date | Status | Borrower | Loan Amount |
|---|---|---|---|
| Open | Knoll Jordan | $235,824 | |
| Previous Owner | Bruce John R | $176,800 | |
| Previous Owner | Bower Donn A | $147,120 |
Source: Public Records
Tax History Compared to Growth
Tax History
| Year | Tax Paid | Tax Assessment Tax Assessment Total Assessment is a certain percentage of the fair market value that is determined by local assessors to be the total taxable value of land and additions on the property. | Land | Improvement |
|---|---|---|---|---|
| 2024 | $2,845 | $30,335 | $6,030 | $24,305 |
| 2023 | $2,845 | $30,335 | $6,030 | $24,305 |
| 2022 | $2,654 | $26,273 | $4,170 | $22,103 |
| 2021 | $2,691 | $27,029 | $4,290 | $22,739 |
| 2020 | $2,555 | $25,793 | $4,290 | $21,503 |
| 2019 | $2,536 | $25,793 | $4,290 | $21,503 |
| 2018 | $2,175 | $22,190 | $3,600 | $18,590 |
| 2017 | $2,119 | $22,190 | $3,600 | $18,590 |
| 2016 | $1,817 | $18,396 | $3,184 | $15,212 |
| 2015 | $1,815 | $18,396 | $3,184 | $15,212 |
| 2014 | $1,815 | $17,170 | $2,229 | $14,941 |
Source: Public Records
Map
Nearby Homes
- 8547 S Upham Way
- 8468 S Upham Way
- 8422 S Upham Way Unit G60
- 8536 S Upham Way
- 8378 S Upham Way Unit B-305
- 8371 S Upham Way Unit 208
- 8361 S Upham Way Unit 209
- 8337 S Upham Way Unit 209
- 8457 S Reed St Unit 1202
- 8321 S Upham Way Unit 2208
- 7667 W Brook Dr
- 8331 S Upham Way Unit 106
- 6995 W Payne Ave
- 8311 S Upham Way
- 8346 S Reed St
- 8595 S Yarrow St
- 6811 W Remington Place
- 8367 S Zephyr St
- 7740 W Phillips Ave
- 8705 S Yarrow St
- 8483 S Upham Way
- 8479 S Upham Way
- 8503 S Upham Way
- 8475 S Upham Way
- 8509 S Upham Way
- 8461 S Upham Way
- 8459 S Upham Way
- 8463 S Upham Way
- 8465 S Upham Way
- 8515 S Upham Way
- 8515 S Upham Way Unit 8515
- 8473 S Upham Way
- 8471 S Upham Way
- 8489 S Upham Way
- 8485 S Upham Way
- 8469 S Upham Way
- 8481 S Upham Way
- 8521 S Upham Way
- 8477 S Upham Way
- 8467 S Upham Way