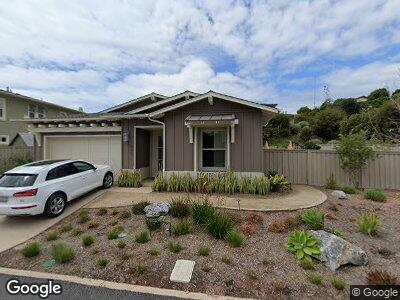
849 Channel Island Dr Encinitas, CA 92024
Estimated Value: $2,013,000 - $2,770,000
3
Beds
3
Baths
1,955
Sq Ft
$1,233/Sq Ft
Est. Value
About This Home
This home is located at 849 Channel Island Dr, Encinitas, CA 92024 and is currently estimated at $2,410,783, approximately $1,233 per square foot. 849 Channel Island Dr is a home with nearby schools including Capri Elementary School, Diegueno Middle School, and La Costa Canyon High School.
Ownership History
Date
Name
Owned For
Owner Type
Purchase Details
Closed on
Mar 28, 2024
Sold by
Huckeby Jill Brown and Brown Jill Elizabeth
Bought by
Huckeby Living Trust and Huckeby
Current Estimated Value
Purchase Details
Closed on
Jan 22, 2021
Sold by
Huckeby Johnny Levi and Brown Jill Elizabeth
Bought by
Brown Jill Elizabeth
Home Financials for this Owner
Home Financials are based on the most recent Mortgage that was taken out on this home.
Original Mortgage
$986,800
Interest Rate
2.6%
Mortgage Type
New Conventional
Purchase Details
Closed on
Oct 27, 2018
Sold by
Brown Jill Elizabeth
Bought by
Huckeby Johnny Levi and Huckeby Elizabeth Jill
Purchase Details
Closed on
Jan 5, 2017
Sold by
Shea Homes Limited Partnership
Bought by
Brown Jill Elizabeth
Home Financials for this Owner
Home Financials are based on the most recent Mortgage that was taken out on this home.
Original Mortgage
$1,048,301
Interest Rate
4.3%
Mortgage Type
New Conventional
Create a Home Valuation Report for This Property
The Home Valuation Report is an in-depth analysis detailing your home's value as well as a comparison with similar homes in the area
Home Values in the Area
Average Home Value in this Area
Purchase History
| Date | Buyer | Sale Price | Title Company |
|---|---|---|---|
| Huckeby Living Trust | -- | None Listed On Document | |
| Brown Jill Elizabeth | -- | Title365 | |
| Huckeby Johnny Levi | -- | None Available | |
| Brown Jill Elizabeth | $1,310,500 | First American Title Company |
Source: Public Records
Mortgage History
| Date | Status | Borrower | Loan Amount |
|---|---|---|---|
| Previous Owner | Brown Jill Elizabeth | $986,800 | |
| Previous Owner | Brown Jill Elizabeth | $1,048,301 |
Source: Public Records
Tax History Compared to Growth
Tax History
| Year | Tax Paid | Tax Assessment Tax Assessment Total Assessment is a certain percentage of the fair market value that is determined by local assessors to be the total taxable value of land and additions on the property. | Land | Improvement |
|---|---|---|---|---|
| 2024 | $16,944 | $1,484,464 | $796,478 | $687,986 |
| 2023 | $16,524 | $1,455,358 | $780,861 | $674,497 |
| 2022 | $16,276 | $1,426,822 | $765,550 | $661,272 |
| 2021 | $15,984 | $1,398,846 | $750,540 | $648,306 |
| 2020 | $15,825 | $1,384,504 | $742,845 | $641,659 |
| 2019 | $15,519 | $1,357,358 | $728,280 | $629,078 |
| 2018 | $14,947 | $1,330,744 | $714,000 | $616,744 |
| 2017 | $191 | $254,648 | $254,648 | $0 |
| 2016 | $2,637 | $249,655 | $249,655 | $0 |
| 2015 | $2,600 | $245,905 | $245,905 | $0 |
| 2014 | $2,550 | $241,089 | $241,089 | $0 |
Source: Public Records
Map
Nearby Homes
- 829 Channel Island Dr
- 614 Polaris Dr
- 1002 Alexandra Ln
- 502 Quail Gardens Dr
- 664 Jocelyn Way
- 623 Quail Gardens Ln
- 869 Eugenie Ave
- 526 Saxony Rd
- 1300 Bergamo Place Unit 101
- 836 Jensen Ct
- 734 Adelaide Cir
- 557 Samuel Ct
- 0 Mays Hollow Ln
- 269 Delphinium St
- 956 Urania Ave
- 444 Alviso Way
- 614 Ocean View Ave
- 571 Lynwood Dr
- 625 Hymettus Ave
- 715 Blossom Rd
- 849 Channel Island Dr
- 853 Channel Island Dr
- 845 Channel Island Dr
- 828 Channel Island Dr
- 857 Channel Island Dr
- 824 Channel Island Dr
- 861 Channel Island Dr
- 820 Channel Island Dr
- 832 Channel Island Dr
- 816 Channel Island Dr
- 865 Channel Island Dr
- 837 Channel Island Dr
- 836 Channel Island Dr
- 701 Passiflora Ave Unit 1
- 701 Passiflora Ave
- 701 Passiflora Ave Unit 72
- 701 Passiflora Ave
- 885 Channel Island Dr
- 848 Channel Island Dr
- 869 Channel Island Dr