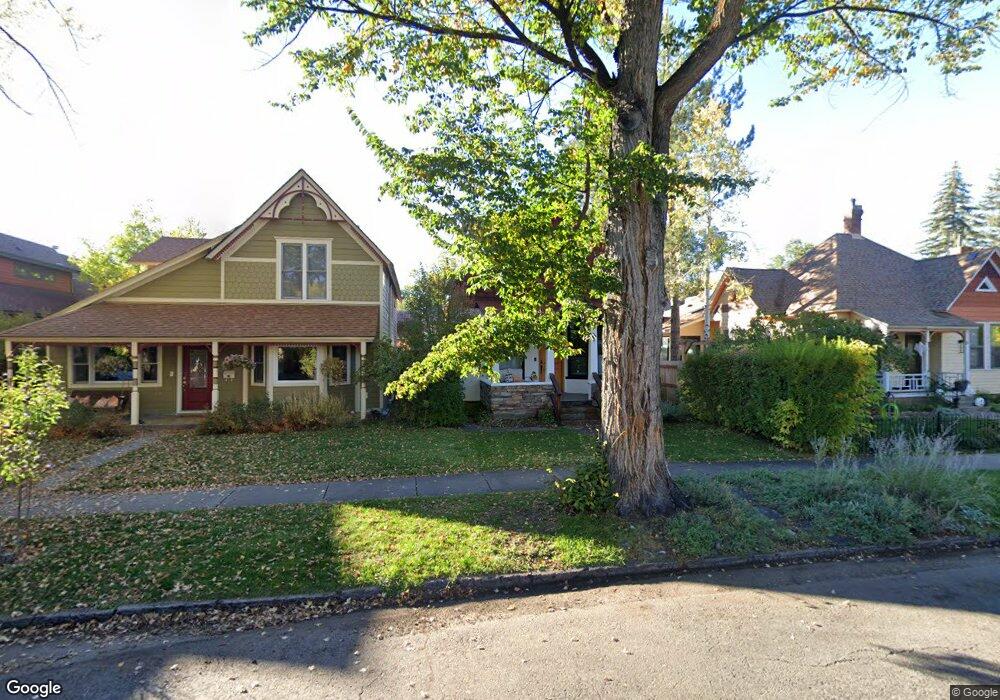
849 E 4th Ave Durango, CO 81301
The Grid NeighborhoodEstimated Value: $777,000 - $1,311,000
3
Beds
2
Baths
1,971
Sq Ft
$573/Sq Ft
Est. Value
About This Home
This home is located at 849 E 4th Ave, Durango, CO 81301 and is currently estimated at $1,128,994, approximately $572 per square foot. 849 E 4th Ave is a home located in La Plata County with nearby schools including Park Elementary School, Escalante Middle School, and Durango High School.
Ownership History
Date
Name
Owned For
Owner Type
Purchase Details
Closed on
Jun 23, 2015
Sold by
Mills Monte and Germer Reagyn A
Bought by
Cheese Christopher R
Current Estimated Value
Home Financials for this Owner
Home Financials are based on the most recent Mortgage that was taken out on this home.
Original Mortgage
$500,000
Outstanding Balance
$389,462
Interest Rate
3.91%
Mortgage Type
New Conventional
Estimated Equity
$739,532
Purchase Details
Closed on
Aug 3, 2009
Sold by
Smith Mark V
Bought by
Germer Reagyn A and Mills Monte
Home Financials for this Owner
Home Financials are based on the most recent Mortgage that was taken out on this home.
Original Mortgage
$268,000
Interest Rate
5.41%
Mortgage Type
New Conventional
Purchase Details
Closed on
May 23, 2008
Sold by
Glazer Edward B and Oliver Janet S
Bought by
Smith Mark
Purchase Details
Closed on
Jun 30, 2000
Bought by
Cheese Christopher R
Create a Home Valuation Report for This Property
The Home Valuation Report is an in-depth analysis detailing your home's value as well as a comparison with similar homes in the area
Home Values in the Area
Average Home Value in this Area
Purchase History
| Date | Buyer | Sale Price | Title Company |
|---|---|---|---|
| Cheese Christopher R | $625,000 | Colorado Land Title Co Llc | |
| Germer Reagyn A | $335,000 | Land Title Guarantee Company | |
| Smith Mark | $389,000 | Land Title | |
| Cheese Christopher R | $169,500 | -- |
Source: Public Records
Mortgage History
| Date | Status | Borrower | Loan Amount |
|---|---|---|---|
| Open | Cheese Christopher R | $500,000 | |
| Previous Owner | Germer Reagyn A | $268,000 |
Source: Public Records
Tax History
| Year | Tax Paid | Tax Assessment Tax Assessment Total Assessment is a certain percentage of the fair market value that is determined by local assessors to be the total taxable value of land and additions on the property. | Land | Improvement |
|---|---|---|---|---|
| 2025 | $3,220 | $77,990 | $13,400 | $64,590 |
| 2024 | $2,739 | $68,160 | $10,280 | $57,880 |
| 2023 | $2,739 | $71,530 | $10,790 | $60,740 |
| 2022 | $2,269 | $74,530 | $11,240 | $63,290 |
| 2021 | $2,278 | $57,400 | $9,680 | $47,720 |
| 2020 | $1,903 | $49,510 | $9,580 | $39,930 |
| 2019 | $1,821 | $49,510 | $9,580 | $39,930 |
| 2018 | $1,687 | $46,440 | $9,080 | $37,360 |
| 2017 | $1,649 | $46,440 | $9,080 | $37,360 |
| 2016 | $1,384 | $42,470 | $8,680 | $33,790 |
| 2015 | $1,297 | $42,470 | $8,680 | $33,790 |
| 2014 | -- | $37,210 | $8,340 | $28,870 |
| 2013 | -- | $37,210 | $8,340 | $28,870 |
Source: Public Records
Map
Nearby Homes
- 834 E 4th Ave
- 960 E 4th Ave
- 0 Tbd Unit 11662135
- 0 Tbd Unit 26426680
- TBD Wilson Gulch Rd
- 768 Main Ave Unit 4
- 558 E 4th Ave
- 270 E College Dr Unit 202
- 522 E 3rd Ave
- 549 E 5th Ave
- 561 E 6th Ave
- 543 E 2nd Ave Unit 1D
- 543 E 2nd Ave Unit 3E
- 458 E 4th Ave
- 125 W 10th St Unit 104
- 555 E 7th Ave
- 732 E 4th St
- 355 E 3rd Ave Unit 112
- 1201 Main Ave Unit 105
- 1330 E 3rd Ave
- 843 E 4th Ave
- 865 E 4th Ave
- 344 E 9th St
- 875 E 4th Ave
- 833 E 4th Ave
- 823 E 4th Ave
- 813 E 4th Ave
- 341 E 8th St
- 838 E 3rd Ave
- 876 E 4th Ave
- 860 E 4th Ave
- 860 E 4th Ave Unit 856 E 4th Avenue
- 844 E 4th Ave
- 822 E 4th Ave
- 866 E 4th Ave
- 349 and 361 E 9th St
- 375 E 9th St
- 349 E 9th St
- 828 E 4th Ave
- 860 & 856 E 4th Ave
Your Personal Tour Guide
Ask me questions while you tour the home.