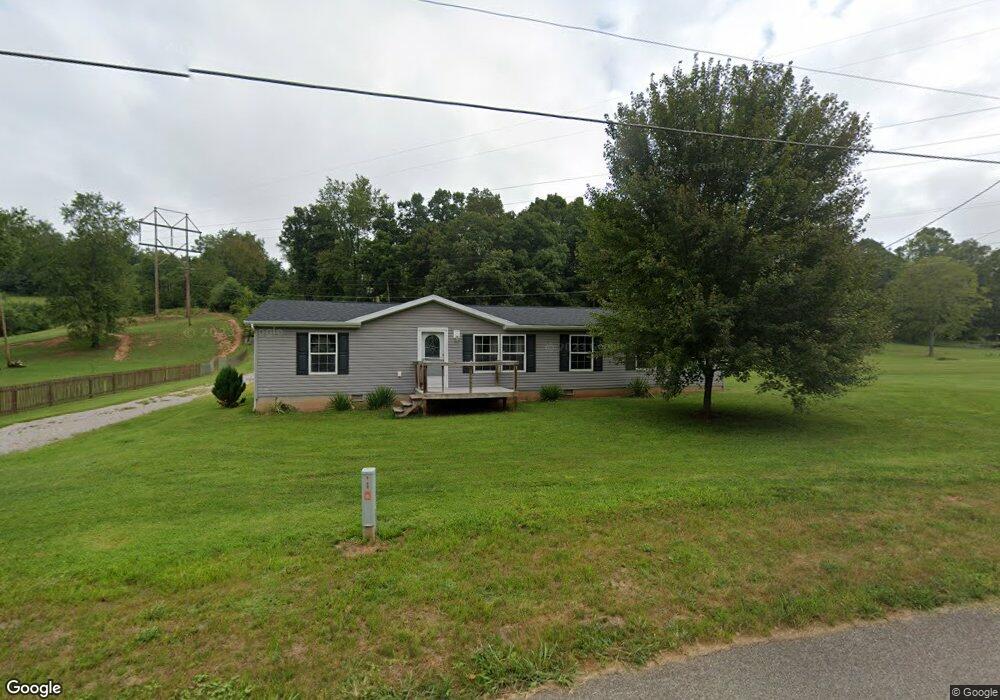
849 Mill Branch Rd Belpre, OH 45714
Estimated Value: $191,000 - $243,000
3
Beds
2
Baths
1,680
Sq Ft
$134/Sq Ft
Est. Value
About This Home
This home is located at 849 Mill Branch Rd, Belpre, OH 45714 and is currently estimated at $225,001, approximately $133 per square foot. 849 Mill Branch Rd is a home with nearby schools including Belpre Elementary School and Belpre High School.
Ownership History
Date
Name
Owned For
Owner Type
Purchase Details
Closed on
Jun 27, 2024
Sold by
Brown Darrell A
Bought by
Brown Family Trust and Brown
Current Estimated Value
Purchase Details
Closed on
Apr 22, 2024
Sold by
Solid Rock Construction Llc
Bought by
Brown Darrell A
Purchase Details
Closed on
Nov 17, 2017
Sold by
Loughry Timothy L and Allen Esther
Bought by
Allen Aaron and Allen Samantha C
Purchase Details
Closed on
May 2, 2007
Sold by
Lang Kelly A and Lang Lucinda S
Bought by
Allen Esther and Allen Aaron
Home Financials for this Owner
Home Financials are based on the most recent Mortgage that was taken out on this home.
Original Mortgage
$94,496
Interest Rate
6.2%
Mortgage Type
Construction
Purchase Details
Closed on
Dec 6, 2005
Sold by
Brown Wililam E and Brown Patricia A
Bought by
Lang Kelly A and Lang Lucinda S
Create a Home Valuation Report for This Property
The Home Valuation Report is an in-depth analysis detailing your home's value as well as a comparison with similar homes in the area
Home Values in the Area
Average Home Value in this Area
Purchase History
| Date | Buyer | Sale Price | Title Company |
|---|---|---|---|
| Brown Family Trust | -- | None Listed On Document | |
| Brown Darrell A | $189,000 | None Listed On Document | |
| Allen Aaron | -- | None Available | |
| Allen Esther | $16,000 | Attorney | |
| Lang Kelly A | $13,333 | None Available |
Source: Public Records
Mortgage History
| Date | Status | Borrower | Loan Amount |
|---|---|---|---|
| Previous Owner | Allen Esther | $94,496 |
Source: Public Records
Tax History Compared to Growth
Tax History
| Year | Tax Paid | Tax Assessment Tax Assessment Total Assessment is a certain percentage of the fair market value that is determined by local assessors to be the total taxable value of land and additions on the property. | Land | Improvement |
|---|---|---|---|---|
| 2024 | $2,366 | $58,270 | $6,850 | $51,420 |
| 2023 | $2,366 | $58,270 | $6,850 | $51,420 |
| 2022 | $2,353 | $58,270 | $6,850 | $51,420 |
| 2021 | $1,893 | $43,990 | $5,910 | $38,080 |
| 2020 | $1,785 | $43,990 | $5,910 | $38,080 |
| 2019 | $1,777 | $43,990 | $5,910 | $38,080 |
| 2018 | $1,746 | $41,780 | $5,380 | $36,400 |
| 2017 | $1,411 | $41,780 | $5,380 | $36,400 |
| 2016 | $1,398 | $41,780 | $5,380 | $36,400 |
| 2015 | $1,233 | $36,280 | $5,120 | $31,160 |
| 2014 | $1,823 | $36,280 | $5,120 | $31,160 |
| 2013 | $1,210 | $36,280 | $5,120 | $31,160 |
Source: Public Records
Map
Nearby Homes
- 155 Ridgewood Blvd
- 1462 State Route 339
- 1396 State Route 339
- 1948 State Route 339
- 105 Darbywood Ln
- 655 Ridgewood Blvd
- 15 Oakmont Dr
- 1310 Oxbow Rd
- 905 Ridgewood Blvd
- 21 Cherry Hills Dr
- 631 Short Brook Rd
- 190 Maze Rd
- 130 Maze Rd
- 2811 Washington Blvd
- 1103 Farson St
- 492 Beach Dr
- 135 Dupont Cir
- 8045 Veto Rd
- 2313 Washington Blvd
- 1556 Mcgill Rd
- 849 T289
- 852 Mill Branch Rd
- 815 Mill Branch Rd
- 921 Mill Branch Rd
- 830 Mill Branch Rd
- 945 Mill Branch Rd
- 320 Emmaus Rd
- 695 Mill Branch Rd
- 695 Mill Branch Rd
- 971 Mill Branch Rd
- 764 Mill Branch Rd
- 354 Emmaus Rd
- 296 Emmaus Rd
- 1007 Mill Branch Rd
- 382 Emmaus Rd
- 363 Emmaus Rd
- 276 Emmaus Rd
- 550 Emmaus Rd
- 33 Adorian Place Rd
- 520 Emmaus Rd