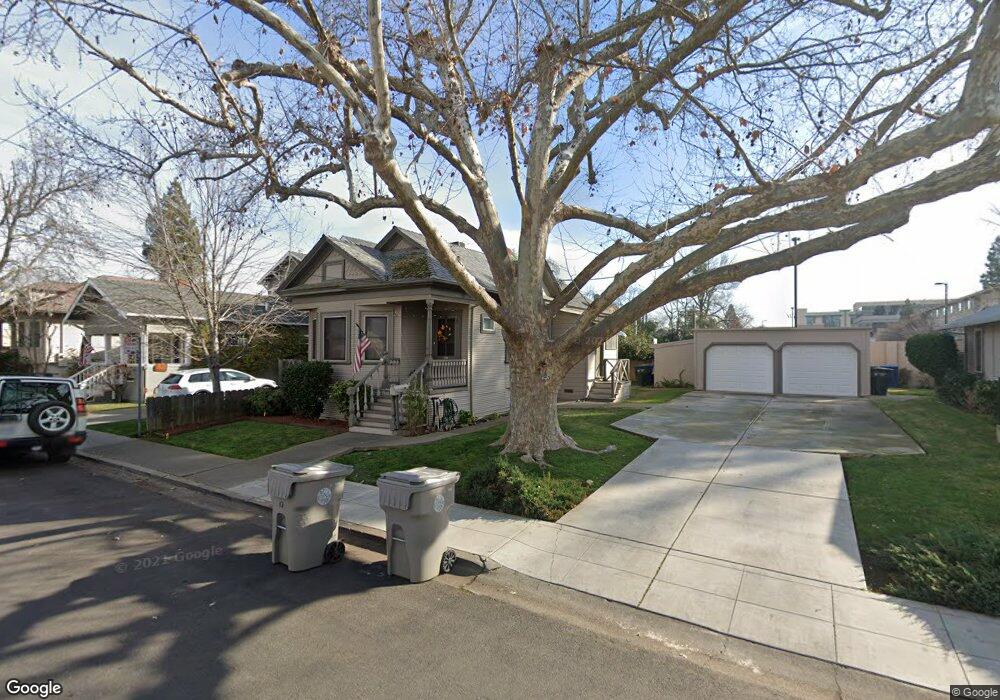
851 38th St Sacramento, CA 95816
East Sacramento NeighborhoodEstimated Value: $476,905 - $616,000
2
Beds
1
Bath
873
Sq Ft
$649/Sq Ft
Est. Value
About This Home
This home is located at 851 38th St, Sacramento, CA 95816 and is currently estimated at $566,476, approximately $648 per square foot. 851 38th St is a home located in Sacramento County with nearby schools including David Lubin Elementary, Miwok Middle School, and Hiram W. Johnson High School.
Ownership History
Date
Name
Owned For
Owner Type
Purchase Details
Closed on
Aug 2, 2010
Sold by
Lipps Nancy L
Bought by
Lipps Nanvy Lee and Nancy Lee Lipps Trust
Current Estimated Value
Purchase Details
Closed on
Dec 2, 2005
Sold by
Lippps Nancy L and Minnie F Martin 1994 Trust
Bought by
Lippps Nancy L
Purchase Details
Closed on
Oct 21, 2004
Sold by
Martin Minnie and Lipps Nancy L
Bought by
Lipps Nancy L and The Minnie F Martin 1994 Trust
Create a Home Valuation Report for This Property
The Home Valuation Report is an in-depth analysis detailing your home's value as well as a comparison with similar homes in the area
Home Values in the Area
Average Home Value in this Area
Purchase History
| Date | Buyer | Sale Price | Title Company |
|---|---|---|---|
| Lipps Nanvy Lee | -- | None Available | |
| Lippps Nancy L | -- | -- | |
| Lipps Nancy L | -- | -- |
Source: Public Records
Tax History Compared to Growth
Tax History
| Year | Tax Paid | Tax Assessment Tax Assessment Total Assessment is a certain percentage of the fair market value that is determined by local assessors to be the total taxable value of land and additions on the property. | Land | Improvement |
|---|---|---|---|---|
| 2025 | $608 | $39,150 | $14,670 | $24,480 |
| 2024 | $608 | $38,383 | $14,383 | $24,000 |
| 2023 | $593 | $37,631 | $14,101 | $23,530 |
| 2022 | $583 | $36,894 | $13,825 | $23,069 |
| 2021 | $558 | $36,171 | $13,554 | $22,617 |
| 2020 | $559 | $35,802 | $13,416 | $22,386 |
| 2019 | $548 | $35,101 | $13,153 | $21,948 |
| 2018 | $535 | $34,414 | $12,896 | $21,518 |
| 2017 | $527 | $33,741 | $12,644 | $21,097 |
| 2016 | $511 | $33,081 | $12,397 | $20,684 |
| 2015 | $503 | $32,585 | $12,211 | $20,374 |
| 2014 | $493 | $31,949 | $11,974 | $19,975 |
Source: Public Records
Map
Nearby Homes