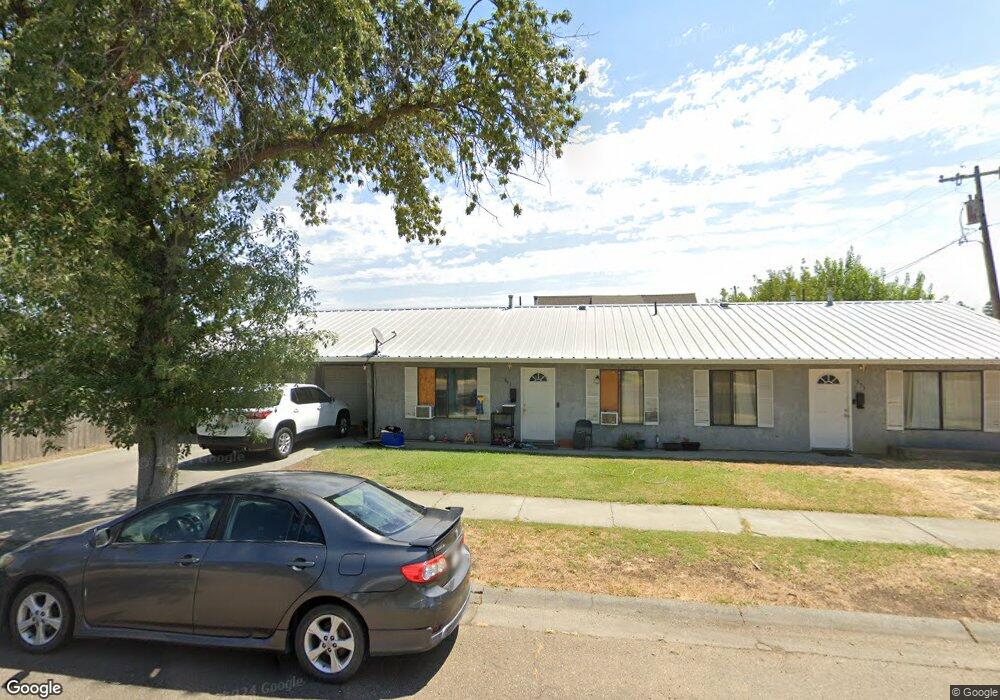
851 Peach St Corning, CA 96021
Estimated Value: $209,000 - $259,000
4
Beds
2
Baths
912
Sq Ft
$257/Sq Ft
Est. Value
About This Home
This home is located at 851 Peach St, Corning, CA 96021 and is currently estimated at $234,837, approximately $257 per square foot. 851 Peach St is a home located in Tehama County with nearby schools including Olive View Elementary School, Maywood Middle School, and Corning High School.
Ownership History
Date
Name
Owned For
Owner Type
Purchase Details
Closed on
Mar 22, 2018
Sold by
Curiel Rosalio and Curiel Gloria
Bought by
Curiel Rosalio and Curiel Gloria
Current Estimated Value
Purchase Details
Closed on
May 23, 2014
Sold by
Heuchert Philip
Bought by
Curiel Rosalio and Curiel Gloria
Purchase Details
Closed on
May 19, 2014
Sold by
Anderson Glenn and Heuchert Anderson Glenys
Bought by
Heuchert Philip
Purchase Details
Closed on
May 1, 2003
Sold by
Heuchert Philip
Bought by
Heuchert Philip
Purchase Details
Closed on
Apr 22, 2003
Sold by
Anderson Glenys and Heuchert Glenys
Bought by
Heuchert Philip
Create a Home Valuation Report for This Property
The Home Valuation Report is an in-depth analysis detailing your home's value as well as a comparison with similar homes in the area
Purchase History
| Date | Buyer | Sale Price | Title Company |
|---|---|---|---|
| Curiel Rosalio | -- | None Available | |
| Curiel Rosalio | $132,500 | Northern California Title Co | |
| Heuchert Philip | -- | Northern California Title Co | |
| Heuchert Philip | -- | -- | |
| Heuchert Philip | -- | -- |
Source: Public Records
Tax History
| Year | Tax Paid | Tax Assessment Tax Assessment Total Assessment is a certain percentage of the fair market value that is determined by local assessors to be the total taxable value of land and additions on the property. | Land | Improvement |
|---|---|---|---|---|
| 2025 | $1,676 | $162,414 | $33,704 | $128,710 |
| 2023 | $1,644 | $156,110 | $32,397 | $123,713 |
| 2022 | $1,621 | $153,050 | $31,762 | $121,288 |
| 2021 | $1,560 | $150,050 | $31,140 | $118,910 |
| 2020 | $1,577 | $148,512 | $30,821 | $117,691 |
| 2019 | $1,512 | $145,601 | $30,217 | $115,384 |
| 2018 | $1,515 | $142,747 | $29,625 | $113,122 |
| 2017 | $1,505 | $139,949 | $29,045 | $110,904 |
| 2016 | $1,403 | $137,206 | $28,476 | $108,730 |
| 2015 | -- | $135,146 | $28,049 | $107,097 |
| 2014 | $1,632 | $157,921 | $29,202 | $128,719 |
Source: Public Records
Map
Nearby Homes
Your Personal Tour Guide
Ask me questions while you tour the home.