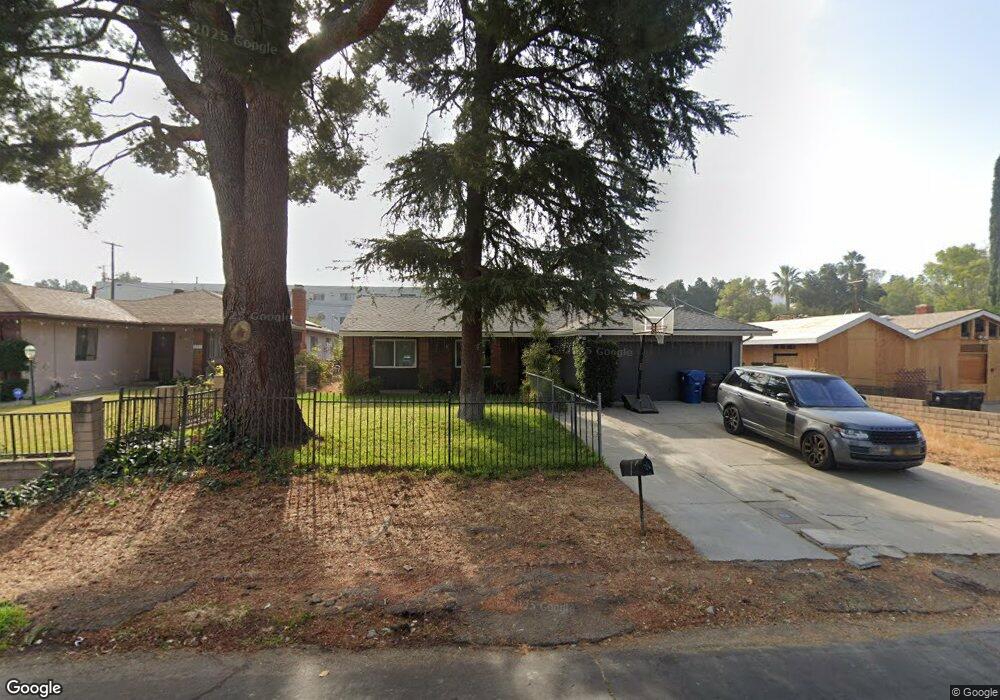
8516 Fenwick St Sunland, CA 91040
Sunland NeighborhoodEstimated Value: $953,565 - $1,008,000
4
Beds
2
Baths
1,600
Sq Ft
$614/Sq Ft
Est. Value
About This Home
This home is located at 8516 Fenwick St, Sunland, CA 91040 and is currently estimated at $982,141, approximately $613 per square foot. 8516 Fenwick St is a home located in Los Angeles County with nearby schools including Sunland Elementary School, Mt. Gleason Middle School, and Verdugo Hills Senior High School.
Ownership History
Date
Name
Owned For
Owner Type
Purchase Details
Closed on
Feb 3, 2010
Sold by
Lamb H Lorene
Bought by
Graham Peter and Graham Anna
Current Estimated Value
Home Financials for this Owner
Home Financials are based on the most recent Mortgage that was taken out on this home.
Original Mortgage
$409,187
Outstanding Balance
$262,145
Interest Rate
4.4%
Mortgage Type
FHA
Estimated Equity
$719,996
Purchase Details
Closed on
Feb 9, 2009
Sold by
Department Of Veterans Affairs Of The St
Bought by
Perry Joseph Lee and The Joseph L Perry Trust
Create a Home Valuation Report for This Property
The Home Valuation Report is an in-depth analysis detailing your home's value as well as a comparison with similar homes in the area
Home Values in the Area
Average Home Value in this Area
Purchase History
| Date | Buyer | Sale Price | Title Company |
|---|---|---|---|
| Graham Peter | $417,500 | Fidelity Van Nuys | |
| Perry Joseph Lee | -- | None Available |
Source: Public Records
Mortgage History
| Date | Status | Borrower | Loan Amount |
|---|---|---|---|
| Open | Graham Peter | $409,187 |
Source: Public Records
Tax History
| Year | Tax Paid | Tax Assessment Tax Assessment Total Assessment is a certain percentage of the fair market value that is determined by local assessors to be the total taxable value of land and additions on the property. | Land | Improvement |
|---|---|---|---|---|
| 2025 | $7,143 | $588,262 | $312,887 | $275,375 |
| 2024 | $7,143 | $576,728 | $306,752 | $269,976 |
| 2023 | $6,430 | $517,482 | $300,738 | $216,744 |
| 2022 | $6,133 | $507,337 | $294,842 | $212,495 |
| 2021 | $6,053 | $497,390 | $289,061 | $208,329 |
| 2019 | $5,872 | $482,639 | $280,489 | $202,150 |
| 2018 | $5,778 | $473,177 | $274,990 | $198,187 |
| 2017 | $5,649 | $463,900 | $269,599 | $194,301 |
| 2016 | $5,512 | $454,805 | $264,313 | $190,492 |
| 2015 | $5,431 | $447,974 | $260,343 | $187,631 |
| 2014 | $5,454 | $439,200 | $255,244 | $183,956 |
Source: Public Records
Map
Nearby Homes
- 8444 Grenoble St
- 10711 Sherman Grove Ave Unit 36
- 8323 Grenoble St Unit 32
- 10799 Sherman Grove Ave Unit 82
- 10799 Sherman Grove Ave Unit 18
- 10353 Oro Vista Ave
- 10412 Eldora Ave
- 10319 Russett Ave
- 10347 Newhome Ave
- 10338 Oro Vista Ave
- 10500 Sunland Blvd Unit 4
- 10504 Sunland Blvd Unit 7
- 10610 Oak Tree Way
- 10323 Eldora Ave
- 8720 Wyngate St
- 8230 Kyle St
- 10535 Nassau Ave
- 8600 Day St
- 8784 1/2 Wyngate St
- 8554 Day St
- 8520 Fenwick St
- 8508 Fenwick St
- 8522 Fenwick St
- 8504 Fenwick St
- 8528 Fenwick St
- 8515 Fenwick St
- 8534 Fenwick St
- 8515 Fenwick St
- 8521 Fenwick St
- 8511 Fenwick St
- 8527 Fenwick St
- 8505 Fenwick St
- 10538 Floralita Ave
- 8540 Fenwick St
- 8457 Grenoble St
- 10523 Floralita Ave
- 10523 Floralita Ave
- 10560 Sherman Grove Ave Unit 10
- 10560 Sherman Grove Ave Unit 7
- 8457 Fenwick St
Your Personal Tour Guide
Ask me questions while you tour the home.