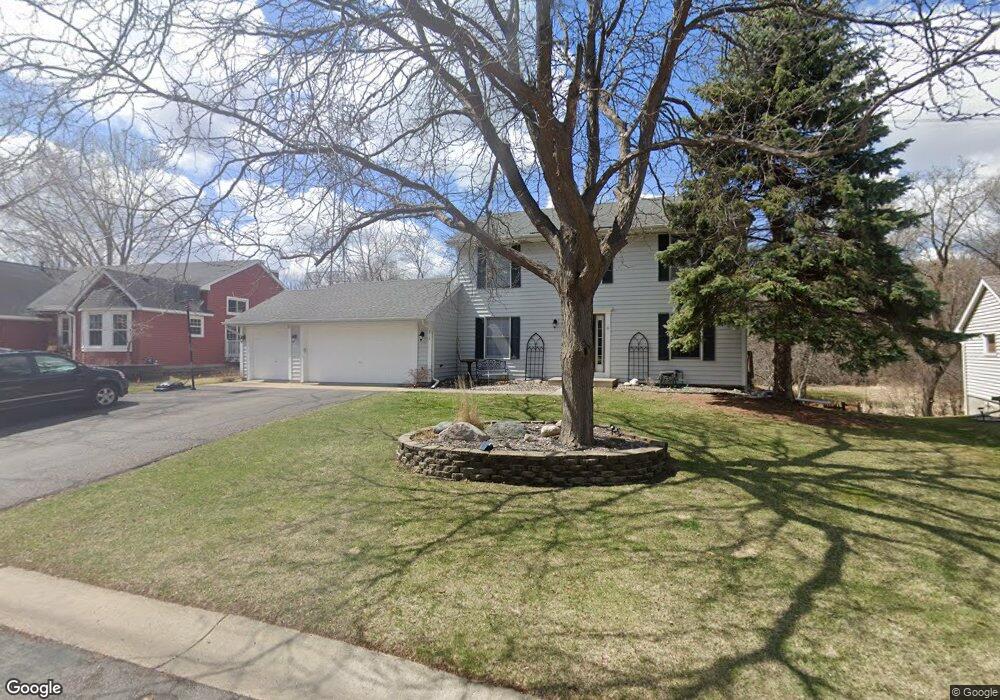
8517 Sycamore Ln N Maple Grove, MN 55369
Estimated Value: $455,317 - $513,000
4
Beds
4
Baths
1,684
Sq Ft
$289/Sq Ft
Est. Value
About This Home
This home is located at 8517 Sycamore Ln N, Maple Grove, MN 55369 and is currently estimated at $486,329, approximately $288 per square foot. 8517 Sycamore Ln N is a home located in Hennepin County with nearby schools including Rice Lake Elementary School, Maple Grove Middle School, and Maple Grove Senior High School.
Ownership History
Date
Name
Owned For
Owner Type
Purchase Details
Closed on
May 30, 2008
Sold by
Grams Kimberly A and Grams Travis J
Bought by
Joseph Mark R and Joseph Danielle R
Current Estimated Value
Purchase Details
Closed on
Aug 31, 2006
Sold by
Bilski John R and Bilski Twyla R
Bought by
Grams Kimberly A and Grams Travis J
Home Financials for this Owner
Home Financials are based on the most recent Mortgage that was taken out on this home.
Original Mortgage
$236,800
Interest Rate
6.7%
Mortgage Type
New Conventional
Purchase Details
Closed on
May 23, 2006
Sold by
Moeller Diann C and Moeller Keith O
Bought by
Bilski John R and Bilski Twyla J
Purchase Details
Closed on
Aug 20, 2003
Sold by
Oneill Terrence M and Oneill Hana L
Bought by
Moeller Diann C
Purchase Details
Closed on
Jun 3, 1996
Sold by
Maas Gregory A
Bought by
O'Neill Terrence M
Create a Home Valuation Report for This Property
The Home Valuation Report is an in-depth analysis detailing your home's value as well as a comparison with similar homes in the area
Home Values in the Area
Average Home Value in this Area
Purchase History
| Date | Buyer | Sale Price | Title Company |
|---|---|---|---|
| Joseph Mark R | $304,500 | -- | |
| Grams Kimberly A | $296,000 | -- | |
| Bilski John R | $285,000 | -- | |
| Moeller Diann C | $257,600 | -- | |
| O'Neill Terrence M | $160,000 | -- |
Source: Public Records
Mortgage History
| Date | Status | Borrower | Loan Amount |
|---|---|---|---|
| Previous Owner | Grams Kimberly A | $236,800 |
Source: Public Records
Tax History Compared to Growth
Tax History
| Year | Tax Paid | Tax Assessment Tax Assessment Total Assessment is a certain percentage of the fair market value that is determined by local assessors to be the total taxable value of land and additions on the property. | Land | Improvement |
|---|---|---|---|---|
| 2024 | $5,142 | $429,100 | $133,600 | $295,500 |
| 2023 | $4,669 | $399,100 | $108,800 | $290,300 |
| 2022 | $4,014 | $401,400 | $105,000 | $296,400 |
| 2021 | $3,801 | $336,500 | $91,000 | $245,500 |
| 2020 | $3,815 | $315,200 | $75,500 | $239,700 |
| 2019 | $3,828 | $301,600 | $72,900 | $228,700 |
| 2018 | $3,929 | $287,100 | $71,300 | $215,800 |
| 2017 | $3,768 | $267,900 | $70,000 | $197,900 |
| 2016 | $3,712 | $261,000 | $70,000 | $191,000 |
| 2015 | $3,928 | $267,800 | $77,000 | $190,800 |
| 2014 | -- | $247,000 | $74,300 | $172,700 |
Source: Public Records
Map
Nearby Homes
- 12989 84th Ave N
- 8405 Underwood Ln N
- 8735 Rosewood Ln N
- 8326 Oakview Ct N
- 8399 Norwood Ln N
- 12598 84th Place N
- 8567 Xenium Ln N
- 12769 88th Ave N
- 13667 84th Place N
- 13773 84th Place N
- 13898 85th Place N
- 13870 85th Ave N
- 10516 Harbor Ln N
- 12509 88th Ave N
- 8949 Rosewood Ln N
- 13590 89th Ave N
- 8473 Rice Lake Rd
- 8461 Rice Lake Rd
- 14085 85th Place N
- 13351 90th Place N
- 8529 Sycamore Ln N
- 8505 Sycamore Ln N
- 8541 Sycamore Ln N
- 8522 Sycamore Ln N
- 8510 Sycamore Ln N
- 8544 Sycamore Ln N
- 8553 Sycamore Ln N
- 13079 Maple Knoll Way
- 13101 Maple Knoll Way
- 12996 Maple Knoll Way
- 12987 85th Place N
- 13037 Maple Knoll Way
- 8575 Sycamore Ln N
- 13150 Maple Knoll Way
- 12964 Maple Knoll Way
- 13005 Maple Knoll Way
- 13000 85th Place N
- 8587 Sycamore Ln N
- 13176 Maple Knoll Way
- 12973 Maple Knoll Way