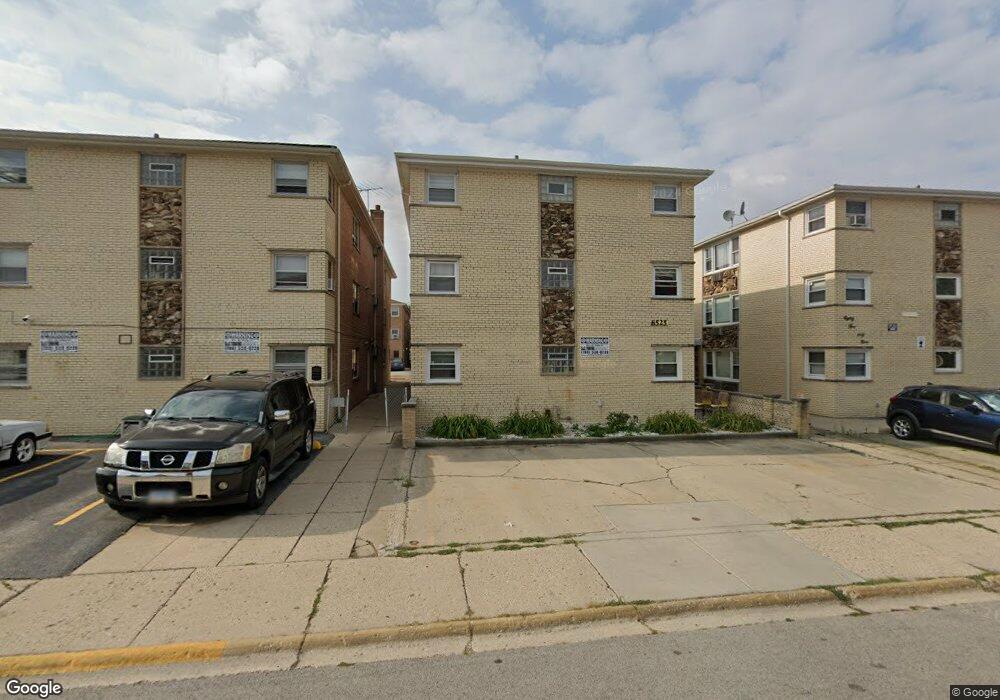
8525 W Catalpa Ave Unit 3N Chicago, IL 60656
O'Hare NeighborhoodEstimated Value: $180,612 - $212,000
--
Bed
--
Bath
6,495
Sq Ft
$31/Sq Ft
Est. Value
About This Home
This home is located at 8525 W Catalpa Ave Unit 3N, Chicago, IL 60656 and is currently estimated at $201,403, approximately $31 per square foot. 8525 W Catalpa Ave Unit 3N is a home located in Cook County with nearby schools including Dirksen Elementary School, William Howard Taft High School, and Brickton Montessori School.
Ownership History
Date
Name
Owned For
Owner Type
Purchase Details
Closed on
Aug 26, 2021
Sold by
Skrzat Paulina M and Skrzat Michal
Bought by
Lasak Adam
Current Estimated Value
Home Financials for this Owner
Home Financials are based on the most recent Mortgage that was taken out on this home.
Original Mortgage
$152,000
Outstanding Balance
$138,206
Interest Rate
2.75%
Mortgage Type
New Conventional
Estimated Equity
$63,197
Purchase Details
Closed on
Jun 27, 2019
Sold by
Graca Krizysztof and Graca Maria
Bought by
Baran Paulina M
Home Financials for this Owner
Home Financials are based on the most recent Mortgage that was taken out on this home.
Original Mortgage
$108,205
Interest Rate
4.5%
Mortgage Type
New Conventional
Purchase Details
Closed on
Mar 28, 2014
Sold by
Graca Krzysztof and Graca Maria
Bought by
Graca Living Trust
Purchase Details
Closed on
Apr 5, 2002
Sold by
Mjm Development Corp
Bought by
Graca Krzysztof and Graca Maria
Create a Home Valuation Report for This Property
The Home Valuation Report is an in-depth analysis detailing your home's value as well as a comparison with similar homes in the area
Home Values in the Area
Average Home Value in this Area
Purchase History
| Date | Buyer | Sale Price | Title Company |
|---|---|---|---|
| Lasak Adam | $160,000 | Altima Title Llc | |
| Baran Paulina M | $114,000 | Attorney | |
| Graca Living Trust | -- | None Available | |
| Graca Krzysztof | $127,500 | -- |
Source: Public Records
Mortgage History
| Date | Status | Borrower | Loan Amount |
|---|---|---|---|
| Open | Lasak Adam | $152,000 | |
| Previous Owner | Baran Paulina M | $108,205 |
Source: Public Records
Tax History Compared to Growth
Tax History
| Year | Tax Paid | Tax Assessment Tax Assessment Total Assessment is a certain percentage of the fair market value that is determined by local assessors to be the total taxable value of land and additions on the property. | Land | Improvement |
|---|---|---|---|---|
| 2024 | $2,743 | $16,449 | $2,184 | $14,265 |
| 2023 | $2,674 | $13,000 | $1,747 | $11,253 |
| 2022 | $2,674 | $13,000 | $1,747 | $11,253 |
| 2021 | $2,614 | $12,999 | $1,747 | $11,252 |
| 2020 | $2,133 | $9,573 | $1,091 | $8,482 |
| 2019 | $1,852 | $12,649 | $1,091 | $11,558 |
| 2018 | $1,820 | $12,649 | $1,091 | $11,558 |
| 2017 | $1,687 | $11,212 | $960 | $10,252 |
| 2016 | $1,745 | $11,212 | $960 | $10,252 |
| 2015 | $1,574 | $11,212 | $960 | $10,252 |
| 2014 | $2,774 | $17,519 | $917 | $16,602 |
| 2013 | $2,708 | $17,519 | $917 | $16,602 |
Source: Public Records
Map
Nearby Homes
- 8510 W Catalpa Ave Unit 1S
- 8510 W Catalpa Ave Unit 2S
- 8510 W Catalpa Ave Unit G
- 8510 W Catalpa Ave Unit 1N
- 8544 W Gregory St
- 5349 N Delphia Ave Unit 150
- 5323 N Delphia Ave Unit 323
- 5348 N Cumberland Ave Unit 204
- 5348 N Cumberland Ave Unit 206
- 5555 N Cumberland Ave Unit 509
- 5555 N Cumberland Ave Unit 901
- 5555 N Cumberland Ave Unit 410
- 5555 N Cumberland Ave Unit 309
- 8340 W Balmoral Ave
- 8610 W Summerdale Ave Unit 3N
- 8622 W Summerdale Ave
- 8344 W Catherine Ave
- 8727 W Bryn Mawr Ave Unit 501
- 8646 W Berwyn Ave Unit 1N
- 8735 W Catherine Ave Unit 8
- 8525 W Catalpa Ave Unit 1S
- 8525 W Catalpa Ave Unit 3S
- 8525 W Catalpa Ave Unit 1N
- 8525 W Catalpa Ave Unit 2S
- 8525 W Catalpa Ave Unit 2N
- 8529 W Catalpa Ave Unit 2S
- 8529 W Catalpa Ave Unit 2S
- 8529 W Catalpa Ave Unit 3S
- 8529 W Catalpa Ave Unit 1S
- 8529 W Catalpa Ave Unit 3N
- 8529 W Catalpa Ave Unit 2S
- 8529 W Catalpa Ave Unit 2N
- 8529 W Catalpa Ave Unit 1N
- 8515 W Catalpa Ave
- 8533 W Catalpa Ave
- 8533 W Catalpa Ave Unit 2N
- 8537 W Catalpa Ave
- 8522 W Rascher Ave
- 8522 W Rascher Ave
- 8518 W Rascher Ave Unit 2