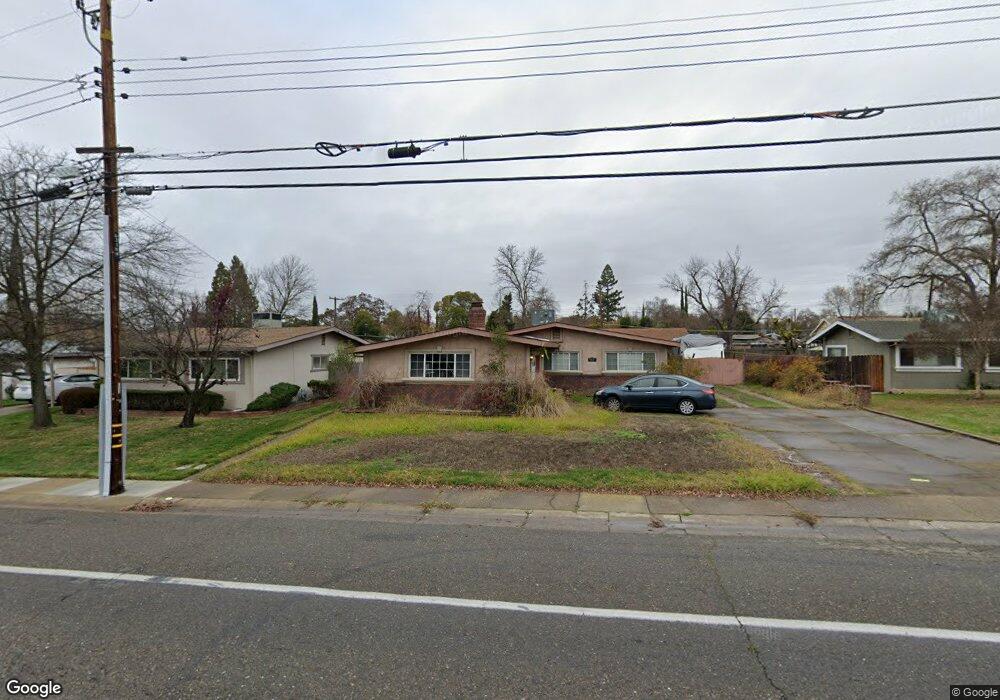
8537 Pershing Ave Fair Oaks, CA 95628
Estimated Value: $418,000 - $443,000
3
Beds
1
Bath
948
Sq Ft
$452/Sq Ft
Est. Value
About This Home
This home is located at 8537 Pershing Ave, Fair Oaks, CA 95628 and is currently estimated at $428,412, approximately $451 per square foot. 8537 Pershing Ave is a home located in Sacramento County with nearby schools including Northridge Elementary School, Andrew Carnegie Middle School, and Bella Vista High School.
Ownership History
Date
Name
Owned For
Owner Type
Purchase Details
Closed on
Apr 18, 2017
Sold by
Puthuff Amy L and Vaughn Robert R
Bought by
Puthuff Spencer L
Current Estimated Value
Home Financials for this Owner
Home Financials are based on the most recent Mortgage that was taken out on this home.
Original Mortgage
$116,000
Outstanding Balance
$96,529
Interest Rate
4.21%
Mortgage Type
New Conventional
Estimated Equity
$331,883
Purchase Details
Closed on
Sep 6, 2016
Sold by
Puthuff Amy L and Vaughn Robert R
Bought by
Puthuff Amy L and Vaughn Robert R
Purchase Details
Closed on
Oct 27, 1998
Sold by
Vaughn Lloyd W and Vaughn Joan
Bought by
Vaughn Lloyd Wright and Vaughn Joan
Purchase Details
Closed on
Jan 26, 1994
Sold by
Darby Richard W and Darby Patricia K
Bought by
Beneficial California Inc
Create a Home Valuation Report for This Property
The Home Valuation Report is an in-depth analysis detailing your home's value as well as a comparison with similar homes in the area
Home Values in the Area
Average Home Value in this Area
Purchase History
| Date | Buyer | Sale Price | Title Company |
|---|---|---|---|
| Puthuff Spencer L | $145,000 | Stewart | |
| Puthuff Amy L | -- | None Available | |
| Vaughn Lloyd Wright | -- | -- | |
| Beneficial California Inc | $46,161 | -- |
Source: Public Records
Mortgage History
| Date | Status | Borrower | Loan Amount |
|---|---|---|---|
| Open | Puthuff Spencer L | $116,000 |
Source: Public Records
Tax History
| Year | Tax Paid | Tax Assessment Tax Assessment Total Assessment is a certain percentage of the fair market value that is determined by local assessors to be the total taxable value of land and additions on the property. | Land | Improvement |
|---|---|---|---|---|
| 2025 | $3,756 | $313,352 | $81,238 | $232,114 |
| 2024 | $3,756 | $307,209 | $79,646 | $227,563 |
| 2023 | $3,662 | $301,186 | $78,085 | $223,101 |
| 2022 | $3,644 | $295,281 | $76,554 | $218,727 |
| 2021 | $3,584 | $289,492 | $75,053 | $214,439 |
| 2020 | $3,519 | $286,525 | $74,284 | $212,241 |
| 2019 | $3,449 | $280,908 | $72,828 | $208,080 |
| 2018 | $3,410 | $275,400 | $71,400 | $204,000 |
| 2017 | $727 | $53,581 | $6,993 | $46,588 |
| 2016 | $602 | $52,531 | $6,856 | $45,675 |
| 2015 | $592 | $51,743 | $6,754 | $44,989 |
| 2014 | $579 | $50,730 | $6,622 | $44,108 |
Source: Public Records
Map
Nearby Homes
- 8524 Oak Harbour Ct
- 5605 Ritz Way
- 8497 Mallee Cir
- 8493 Mallee Cir
- 8626 Pershing Ave
- 8643 Monica Ave
- 8460 Bonita Downs Dr
- 8458 Wattle Way
- 5564 Fetz Ln
- 5596 Fetz Ln
- 5556 Fetz Ln
- 5548 Fetz Ln
- 5540 Fetz Ln
- 6051 Kenneth Oak Way
- 5581 Turnbull Cir
- 8758 Corinne Dr
- 8366 Madison Ave
- 8430 Scenic Vista Way
- 5724 Beech Ave
- 8242 Treecrest Ave
- 8543 Pershing Ave
- 8531 Pershing Ave
- 8549 Pershing Ave
- 8525 Pershing Ave
- 8536 Almaz Ave
- 8542 Almaz Ave
- 8530 Almaz Ave
- 8532 Pershing Ave
- 8548 Almaz Ave
- 8524 Almaz Ave
- 8542 Pershing Ave
- 8519 Pershing Ave
- 5649 Marchese Ct
- 8546 Pershing Ave
- 8555 Pershing Ave
- 8518 Almaz Ave
- 8554 Almaz Ave
- 8513 Pershing Ave
- 8557 Pershing Ave
Your Personal Tour Guide
Ask me questions while you tour the home.