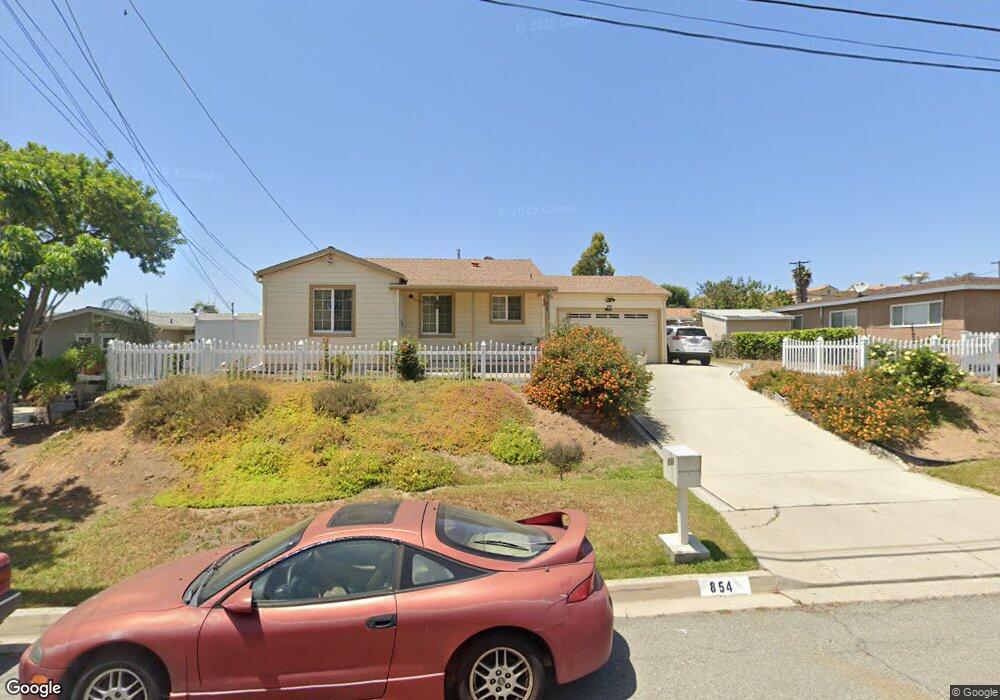
854 Felicita Ave Spring Valley, CA 91977
Estimated Value: $643,000 - $703,000
2
Beds
1
Bath
864
Sq Ft
$780/Sq Ft
Est. Value
About This Home
This home is located at 854 Felicita Ave, Spring Valley, CA 91977 and is currently estimated at $674,294, approximately $780 per square foot. 854 Felicita Ave is a home located in San Diego County with nearby schools including Kempton Literacy Academy, Science, Technology, Engineering, Arts, And Math Academy, and Mount Miguel High School.
Ownership History
Date
Name
Owned For
Owner Type
Purchase Details
Closed on
Aug 19, 2008
Sold by
Oconnell William R and Oconnell Gail A
Bought by
Oconnell William R and Oconnell Gail A
Current Estimated Value
Purchase Details
Closed on
Aug 29, 2000
Sold by
Van Brown L
Bought by
Oconnell William Roy and Oconnell Gail Ann
Home Financials for this Owner
Home Financials are based on the most recent Mortgage that was taken out on this home.
Original Mortgage
$119,950
Outstanding Balance
$46,464
Interest Rate
8.99%
Estimated Equity
$627,830
Purchase Details
Closed on
Jun 23, 1989
Purchase Details
Closed on
Nov 7, 1988
Purchase Details
Closed on
Jan 30, 1985
Create a Home Valuation Report for This Property
The Home Valuation Report is an in-depth analysis detailing your home's value as well as a comparison with similar homes in the area
Home Values in the Area
Average Home Value in this Area
Purchase History
| Date | Buyer | Sale Price | Title Company |
|---|---|---|---|
| Oconnell William R | -- | None Available | |
| Oconnell William R | -- | None Available | |
| Oconnell William Roy | $150,000 | American Title Ins Co | |
| -- | $98,000 | -- | |
| -- | $91,000 | -- | |
| -- | $73,000 | -- |
Source: Public Records
Mortgage History
| Date | Status | Borrower | Loan Amount |
|---|---|---|---|
| Open | Oconnell William Roy | $119,950 | |
| Closed | Oconnell William Roy | $30,050 |
Source: Public Records
Tax History Compared to Growth
Tax History
| Year | Tax Paid | Tax Assessment Tax Assessment Total Assessment is a certain percentage of the fair market value that is determined by local assessors to be the total taxable value of land and additions on the property. | Land | Improvement |
|---|---|---|---|---|
| 2025 | $3,173 | $225,998 | $100,440 | $125,558 |
| 2024 | $3,173 | $221,568 | $98,471 | $123,097 |
| 2023 | $3,067 | $217,225 | $96,541 | $120,684 |
| 2022 | $3,006 | $212,967 | $94,649 | $118,318 |
| 2021 | $2,980 | $208,793 | $92,794 | $115,999 |
| 2020 | $2,855 | $206,653 | $91,843 | $114,810 |
| 2019 | $2,810 | $202,602 | $90,043 | $112,559 |
| 2018 | $2,711 | $198,630 | $88,278 | $110,352 |
| 2017 | $2,633 | $194,737 | $86,548 | $108,189 |
| 2016 | $2,528 | $190,919 | $84,851 | $106,068 |
| 2015 | $2,505 | $188,052 | $83,577 | $104,475 |
| 2014 | $2,462 | $184,369 | $81,940 | $102,429 |
Source: Public Records
Map
Nearby Homes
- 733 Sacramento Ave
- 0 Grand Ave Unit PW25084786
- 757 Grand Ave
- 9135 Orville St
- 1034 Leland St Unit 15
- 1034 Leland St Unit 14
- 1015-17 Grand Ave
- 9258 Birch St
- 861 Paraiso Ave
- 969 985 Gillespie Dr
- 935 Ramona Ave
- 9208 Harness St
- 1040 Gillespie Dr
- 9240 Harness St
- 9240 Harness St Unit 1
- 1116 Maria Ave
- 445 Kempton St
- 1604 Presioca St Unit 23
- 1145 Helix St Unit 4
- 1145 Helix St Unit 1
- 848 Felicita Ave
- 860 Felicita Ave
- 855 Kempton St
- 853 Kempton St
- 847 Kempton St
- 865 Kempton St
- 840 Felicita Ave
- 853 Felicita Ave
- 839 Kempton St
- 847 Felicita Ave
- 863 Felicita Ave
- 9220 Piedmont St
- 832 Felicita Ave
- 839 Felicita Ave
- 9205 Piedmont St
- 835 Kempton St
- 912 Felicita Ave
- 829 Kempton St
- 909 Felicita Ave
- 856 Concepcion Ave