Estimated Value: $205,994 - $293,000
Studio
--
Bath
2,286
Sq Ft
$110/Sq Ft
Est. Value
About This Home
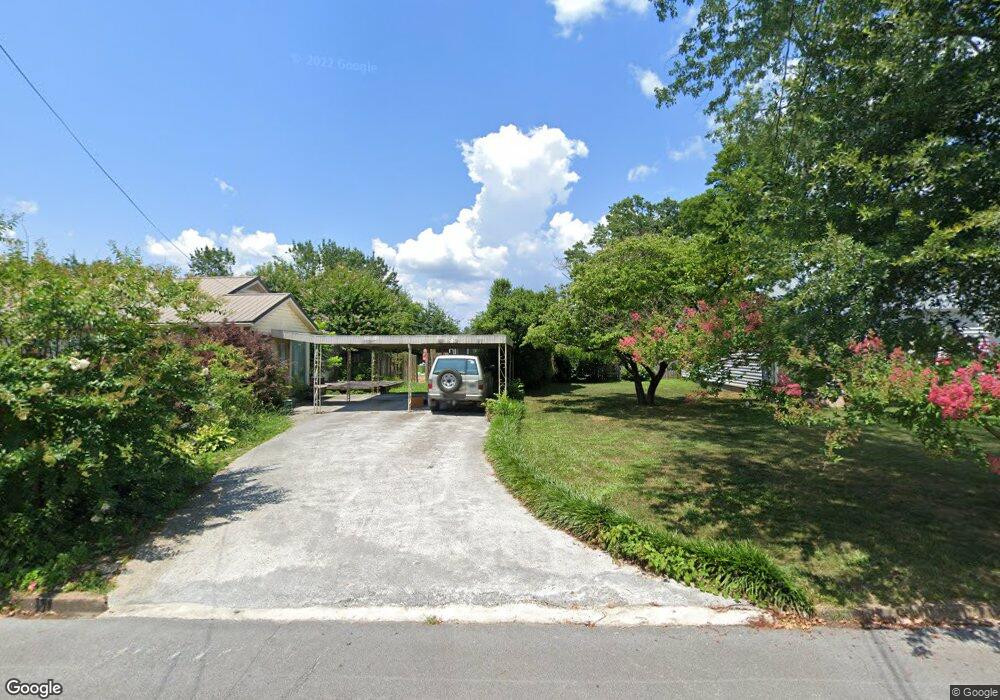
This home is located at 86 Moore St, Trion, GA 30753 and is currently estimated at $251,749, approximately $110 per square foot. 86 Moore St is a home with nearby schools including Trion Elementary School, Trion Middle School, and Trion High School.
Ownership History
Date
Name
Owned For
Owner Type
Purchase Details
Closed on
Sep 17, 2015
Sold by
Jenkins Jeffrey
Bought by
Thomas Laura M
Current Estimated Value
Home Financials for this Owner
Home Financials are based on the most recent Mortgage that was taken out on this home.
Original Mortgage
$135,500
Outstanding Balance
$107,396
Interest Rate
4.5%
Mortgage Type
FHA
Estimated Equity
$144,353
Purchase Details
Closed on
Sep 20, 2013
Sold by
Gillilan Doris N
Bought by
Jenkins Jeffrey William and Jenkins Stephanie
Create a Home Valuation Report for This Property
The Home Valuation Report is an in-depth analysis detailing your home's value as well as a comparison with similar homes in the area
Home Values in the Area
Average Home Value in this Area
Purchase History
| Date | Buyer | Sale Price | Title Company |
|---|---|---|---|
| Thomas Laura M | $138,000 | -- | |
| Jenkins Jeffrey William | -- | -- |
Source: Public Records
Mortgage History
| Date | Status | Borrower | Loan Amount |
|---|---|---|---|
| Open | Thomas Laura M | $135,500 |
Source: Public Records
Tax History
| Year | Tax Paid | Tax Assessment Tax Assessment Total Assessment is a certain percentage of the fair market value that is determined by local assessors to be the total taxable value of land and additions on the property. | Land | Improvement |
|---|---|---|---|---|
| 2025 | $1,934 | $84,056 | $2,000 | $82,056 |
| 2024 | $2,008 | $84,056 | $2,000 | $82,056 |
| 2023 | $2,486 | $84,216 | $11,200 | $73,016 |
| 2022 | $782 | $48,685 | $3,133 | $45,552 |
| 2021 | $653 | $35,586 | $3,133 | $32,453 |
| 2020 | $698 | $35,586 | $3,133 | $32,453 |
| 2019 | $711 | $35,586 | $3,133 | $32,453 |
| 2018 | $677 | $36,498 | $3,175 | $33,323 |
| 2017 | $689 | $36,498 | $3,175 | $33,323 |
| 2016 | $553 | $36,498 | $3,175 | $33,323 |
| 2015 | -- | $34,075 | $3,175 | $30,900 |
| 2014 | -- | $30,327 | $3,175 | $27,152 |
| 2013 | -- | $30,327 | $3,175 | $27,152 |
Source: Public Records
Map
Nearby Homes
- 220 Harrell St
- 97 S Pine St
- 148 Simmons St
- 206 Pine St
- 69 Myers Ave
- 51 Oak St
- 78 Oak St
- 161 Elm St
- 96 S Second St
- 157 Park Ave
- 743 Pine St
- 1670 Back Penn Rd
- 1661 Back Penn Rd
- 946 Pine St
- 0 Lake View Cir Unit 10426229
- 0 Highway 27 Unit 10692665
- 0 Highway 27 Unit 7719925
- 0 Us Highway 27
- 41 Sixth St
- 1241 Back Penn Rd
Your Personal Tour Guide
Ask me questions while you tour the home.