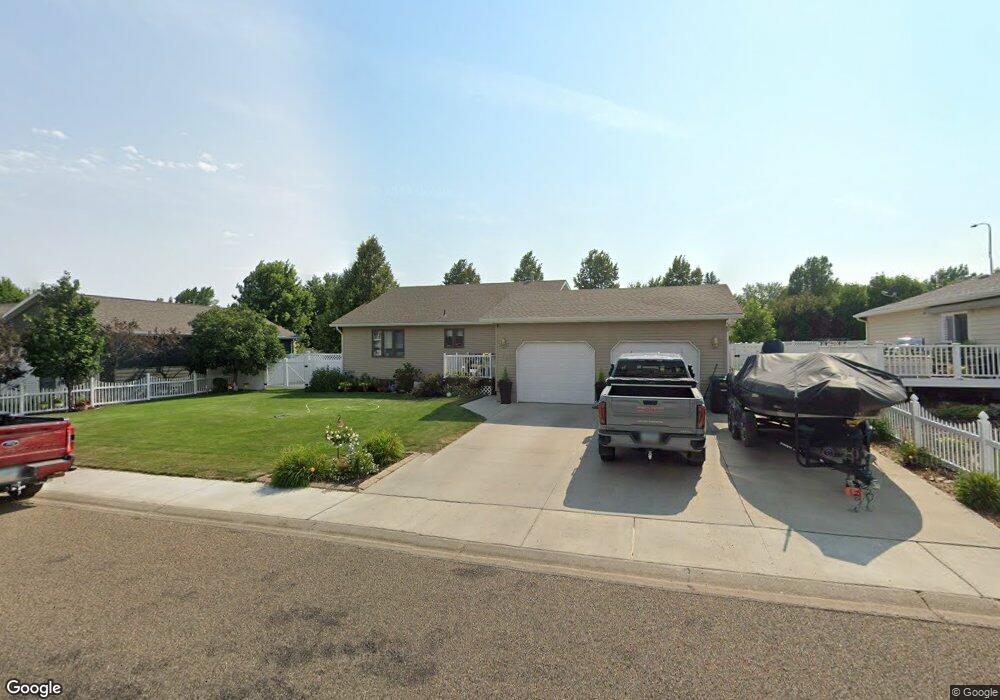
860 13th St E Dickinson, ND 58601
Estimated Value: $295,000 - $342,000
3
Beds
2
Baths
1,024
Sq Ft
$305/Sq Ft
Est. Value
About This Home
This home is located at 860 13th St E, Dickinson, ND 58601 and is currently estimated at $311,817, approximately $304 per square foot. 860 13th St E is a home located in Stark County with nearby schools including Trinity Catholic Schools and Trinity Elementary School East.
Ownership History
Date
Name
Owned For
Owner Type
Purchase Details
Closed on
Feb 12, 2007
Sold by
Klein Bonnie and Klein Brad
Bought by
Brewer Michael and Brewer Nadine
Current Estimated Value
Purchase Details
Closed on
Dec 27, 2005
Sold by
Erickson Charles E and Erickson Dianne G
Bought by
Brewer Michael J and Brewer Nadine
Home Financials for this Owner
Home Financials are based on the most recent Mortgage that was taken out on this home.
Original Mortgage
$119,900
Interest Rate
6.48%
Mortgage Type
New Conventional
Create a Home Valuation Report for This Property
The Home Valuation Report is an in-depth analysis detailing your home's value as well as a comparison with similar homes in the area
Home Values in the Area
Average Home Value in this Area
Purchase History
| Date | Buyer | Sale Price | Title Company |
|---|---|---|---|
| Brewer Michael | $1,200 | None Available | |
| Brewer Michael J | -- | Queen City Abstract Title & |
Source: Public Records
Mortgage History
| Date | Status | Borrower | Loan Amount |
|---|---|---|---|
| Previous Owner | Brewer Michael J | $119,900 |
Source: Public Records
Tax History
| Year | Tax Paid | Tax Assessment Tax Assessment Total Assessment is a certain percentage of the fair market value that is determined by local assessors to be the total taxable value of land and additions on the property. | Land | Improvement |
|---|---|---|---|---|
| 2025 | $2,627 | $225,100 | $37,800 | $187,300 |
| 2024 | $2,863 | $225,100 | $37,800 | $187,300 |
| 2023 | $2,813 | $225,100 | $37,800 | $187,300 |
| 2022 | $2,715 | $106,050 | $0 | $0 |
| 2021 | $2,067 | $200,900 | $37,800 | $163,100 |
| 2020 | $2,095 | $200,900 | $37,800 | $163,100 |
| 2019 | $2,101 | $200,900 | $37,800 | $163,100 |
| 2017 | $1,985 | $209,000 | $37,800 | $171,200 |
| 2015 | $1,985 | $226,700 | $36,900 | $189,800 |
| 2014 | $2,080 | $220,000 | $36,900 | $183,100 |
| 2013 | -- | $213,300 | $36,900 | $176,400 |
Source: Public Records
Map
Nearby Homes
Your Personal Tour Guide
Ask me questions while you tour the home.