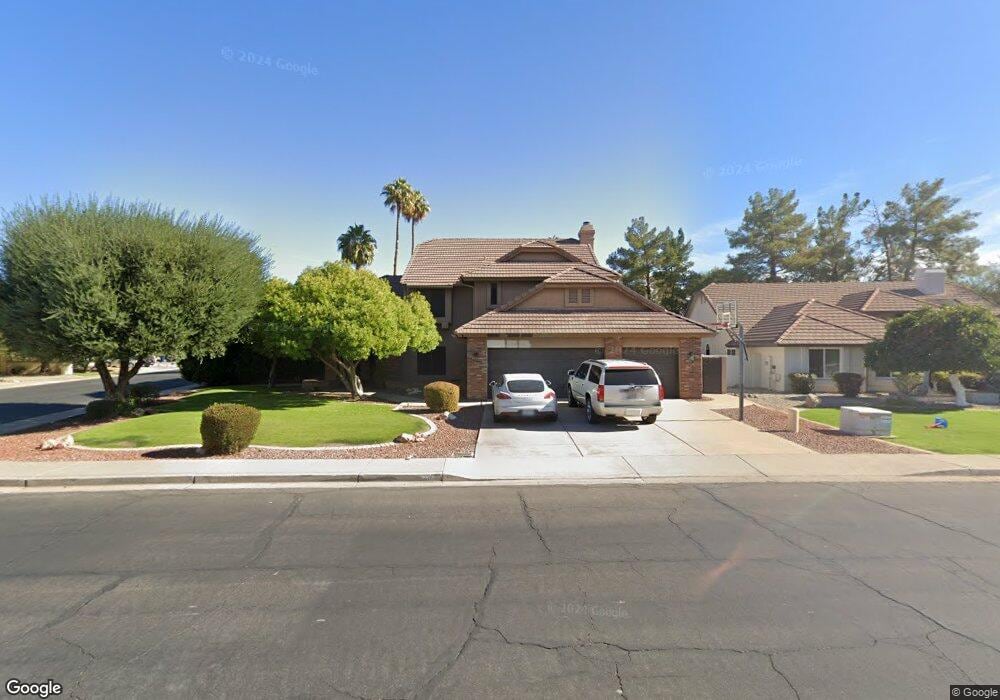
8603 S Los Feliz Dr Tempe, AZ 85284
South Tempe NeighborhoodEstimated Value: $736,813 - $790,000
--
Bed
4
Baths
2,512
Sq Ft
$308/Sq Ft
Est. Value
About This Home
This home is located at 8603 S Los Feliz Dr, Tempe, AZ 85284 and is currently estimated at $774,703, approximately $308 per square foot. 8603 S Los Feliz Dr is a home located in Maricopa County with nearby schools including C I Waggoner School, Kyrene Middle School, and Corona Del Sol High School.
Ownership History
Date
Name
Owned For
Owner Type
Purchase Details
Closed on
Dec 10, 2020
Sold by
Odonnell Michael A and Odonnell Joy A
Bought by
Odonnell Michael A and Odonnell Joy A
Current Estimated Value
Purchase Details
Closed on
Dec 28, 2004
Sold by
Mcgill Patrick J and Mcgill Nancy L
Bought by
Odonnell Michael A and Odonnell Joy A
Home Financials for this Owner
Home Financials are based on the most recent Mortgage that was taken out on this home.
Original Mortgage
$319,920
Outstanding Balance
$150,743
Interest Rate
4.75%
Mortgage Type
Purchase Money Mortgage
Estimated Equity
$623,960
Purchase Details
Closed on
Aug 6, 1999
Sold by
Andresen Alan J and Sinha Vandana
Bought by
Mcgill Patrick J and Mcgill Nancy L
Home Financials for this Owner
Home Financials are based on the most recent Mortgage that was taken out on this home.
Original Mortgage
$195,412
Interest Rate
7.56%
Mortgage Type
VA
Create a Home Valuation Report for This Property
The Home Valuation Report is an in-depth analysis detailing your home's value as well as a comparison with similar homes in the area
Home Values in the Area
Average Home Value in this Area
Purchase History
| Date | Buyer | Sale Price | Title Company |
|---|---|---|---|
| Odonnell Michael A | -- | None Available | |
| Odonnell Michael A | $399,900 | Fidelity National Title | |
| Mcgill Patrick J | $229,000 | Capital Title Agency Inc |
Source: Public Records
Mortgage History
| Date | Status | Borrower | Loan Amount |
|---|---|---|---|
| Open | Odonnell Michael A | $319,920 | |
| Previous Owner | Mcgill Patrick J | $195,412 | |
| Closed | Odonnell Michael A | $59,985 |
Source: Public Records
Tax History Compared to Growth
Tax History
| Year | Tax Paid | Tax Assessment Tax Assessment Total Assessment is a certain percentage of the fair market value that is determined by local assessors to be the total taxable value of land and additions on the property. | Land | Improvement |
|---|---|---|---|---|
| 2025 | $3,999 | $42,181 | -- | -- |
| 2024 | $3,750 | $40,172 | -- | -- |
| 2023 | $3,750 | $52,650 | $10,530 | $42,120 |
| 2022 | $3,548 | $40,770 | $8,150 | $32,620 |
| 2021 | $3,661 | $38,700 | $7,740 | $30,960 |
| 2020 | $3,574 | $37,110 | $7,420 | $29,690 |
| 2019 | $3,461 | $36,410 | $7,280 | $29,130 |
| 2018 | $3,344 | $33,770 | $6,750 | $27,020 |
| 2017 | $3,206 | $32,180 | $6,430 | $25,750 |
| 2016 | $3,251 | $33,070 | $6,610 | $26,460 |
| 2015 | $3,003 | $30,750 | $6,150 | $24,600 |
Source: Public Records
Map
Nearby Homes
- 1983 E Palomino Dr
- 1938 E Calle de Caballos
- 1971 E Buena Vista Dr
- 1966 E Calle de Arcos
- 8856 S Taylor Dr
- 1962 E Ranch Rd Unit 3
- 1809 E Carver Rd
- 2007 E Ranch Rd
- 1830 E Secretariat Dr
- 1454 E Calle de Arcos
- 1861 E Krista Way
- 1975 E Sunburst Ln
- 1910 E Sunburst Ln
- 8606 S Dorsey Ln
- 1739 E Knox Rd
- 1444 E Myrna Ln
- 1938 E Brentrup Dr
- 7745 S Juniper St
- 2173 E La Vieve Ln
- 8629 S Stanley Place
- 8611 S Los Feliz Dr
- 1947 E Palomino Dr
- 1940 E Palomino Dr
- 1944 E Morgan Dr
- 1946 E Palomino Dr
- 8621 S Los Feliz Dr
- 1953 E Palomino Dr
- 8536 S Los Feliz Dr
- 8606 S Los Feliz Dr
- 1952 E Palomino Dr Unit 4
- 8630 S Holbrook Ln
- 8528 S Los Feliz Dr
- 1950 E Morgan Dr
- 8629 S Los Feliz Dr
- 1957 E Palomino Dr
- 1956 E Palomino Dr
- 1943 E El Freda Rd
- 1947 E El Freda Rd
- 1931 E Palomino Dr
- 1924 E Palomino Dr