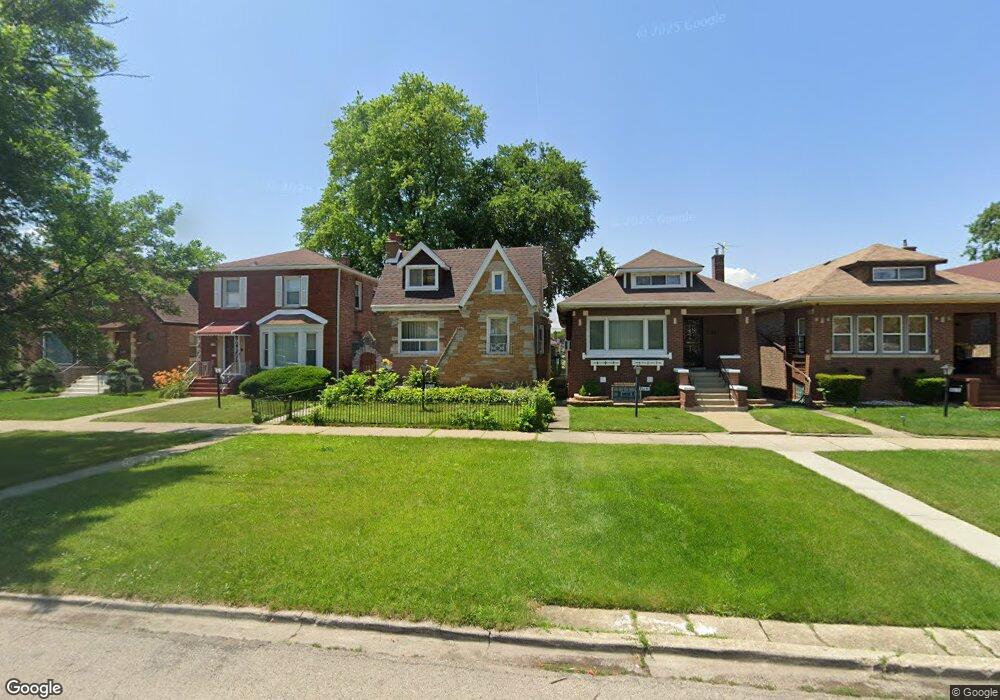
8616 S Calumet Ave Chicago, IL 60619
Chatham NeighborhoodEstimated Value: $214,000 - $263,129
3
Beds
2
Baths
1,347
Sq Ft
$184/Sq Ft
Est. Value
About This Home
This home is located at 8616 S Calumet Ave, Chicago, IL 60619 and is currently estimated at $247,282, approximately $183 per square foot. 8616 S Calumet Ave is a home located in Cook County with nearby schools including Neil Elementary School, Harlan Community Academy High School, and Rescue Missionary Christian School.
Ownership History
Date
Name
Owned For
Owner Type
Purchase Details
Closed on
Aug 13, 2021
Sold by
Oneil Ameera Ashraf and Oneil Errol
Bought by
Oneil Ameera Ashraf
Current Estimated Value
Purchase Details
Closed on
Oct 26, 2009
Sold by
Esther W Anderson Trust
Bought by
Oneil Ameera Ashraf
Home Financials for this Owner
Home Financials are based on the most recent Mortgage that was taken out on this home.
Original Mortgage
$147,283
Interest Rate
4.78%
Mortgage Type
FHA
Purchase Details
Closed on
Feb 28, 2005
Sold by
Anderson Esther W
Bought by
Anderson Esther W
Purchase Details
Closed on
Jun 15, 1998
Sold by
Payne Karen W and White Kenneth W
Bought by
Anderson Esther
Purchase Details
Closed on
Dec 4, 1993
Sold by
White Kenneth A and Payne Karen
Bought by
Anderson Esther W and White Kenneth A
Create a Home Valuation Report for This Property
The Home Valuation Report is an in-depth analysis detailing your home's value as well as a comparison with similar homes in the area
Home Values in the Area
Average Home Value in this Area
Purchase History
| Date | Buyer | Sale Price | Title Company |
|---|---|---|---|
| Oneil Ameera Ashraf | -- | Title 365 | |
| Oneil Ameera Ashraf | $150,000 | Chicago Title Insurance Co | |
| Anderson Esther W | -- | -- | |
| Anderson Esther | -- | Chicago Title Insurance Co | |
| Anderson Esther W | -- | -- |
Source: Public Records
Mortgage History
| Date | Status | Borrower | Loan Amount |
|---|---|---|---|
| Previous Owner | Oneil Ameera Ashraf | $147,283 |
Source: Public Records
Tax History Compared to Growth
Tax History
| Year | Tax Paid | Tax Assessment Tax Assessment Total Assessment is a certain percentage of the fair market value that is determined by local assessors to be the total taxable value of land and additions on the property. | Land | Improvement |
|---|---|---|---|---|
| 2024 | $3,731 | $17,501 | $3,668 | $13,833 |
| 2023 | $3,616 | $21,000 | $4,890 | $16,110 |
| 2022 | $3,616 | $21,000 | $4,890 | $16,110 |
| 2021 | $3,553 | $21,000 | $4,890 | $16,110 |
| 2020 | $2,189 | $12,928 | $3,912 | $9,016 |
| 2019 | $2,165 | $14,207 | $3,912 | $10,295 |
| 2018 | $2,128 | $14,207 | $3,912 | $10,295 |
| 2017 | $2,449 | $14,751 | $3,423 | $11,328 |
| 2016 | $2,454 | $14,751 | $3,423 | $11,328 |
| 2015 | $2,222 | $14,751 | $3,423 | $11,328 |
| 2014 | $1,765 | $12,080 | $2,934 | $9,146 |
| 2013 | $1,719 | $12,080 | $2,934 | $9,146 |
Source: Public Records
Map
Nearby Homes
- 8623 S Prairie Ave
- 8605 S Calumet Ave
- 315 E 87th St
- 323 E 87th St
- 8732 S Calumet Ave
- 8726 S Indiana Ave
- 8622 S Michigan Ave
- 8623 S Vernon Ave
- 8720 S Michigan Ave
- 8458 S Vernon Ave
- 8715 S Wabash Ave
- 8414 S King Dr
- 432 E 88th St
- 8505 S Vernon Ave
- 508 E 87th St
- 448 E 88th St
- 430 E 88th Place
- 8730 S Wabash Ave
- 8343 S Calumet Ave
- 545 E 86th St
- 8614 S Calumet Ave
- 8620 S Calumet Ave
- 8612 S Calumet Ave
- 8622 S Calumet Ave
- 8608 S Calumet Ave
- 8626 S Calumet Ave
- 8604 S Calumet Ave
- 8628 S Calumet Ave
- 8630 S Calumet Ave
- 8600 S Calumet Ave
- 8634 S Calumet Ave
- 8621 S Prairie Ave
- 8615 S Prairie Ave
- 8611 S Prairie Ave
- 8609 S Prairie Ave
- 8627 S Prairie Ave
- 8638 S Calumet Ave
- 8629 S Prairie Ave
- 8605 S Prairie Ave Unit 1
- 8633 S Prairie Ave