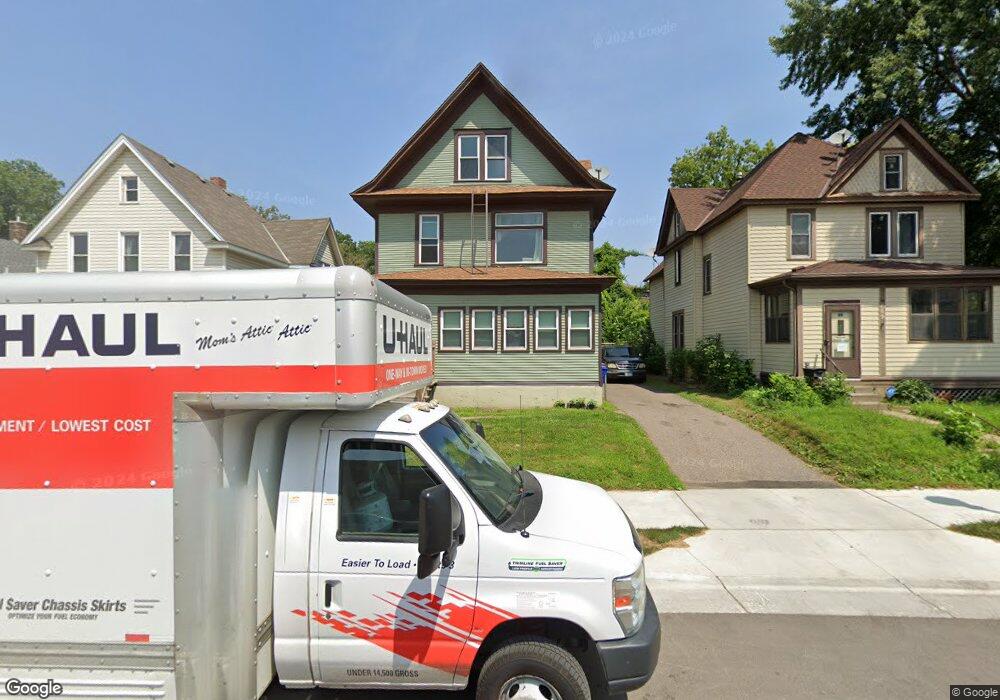
863 Hudson Rd Saint Paul, MN 55106
Dayton's Bluff NeighborhoodEstimated Value: $165,851 - $332,000
2
Beds
2
Baths
2,270
Sq Ft
$114/Sq Ft
Est. Value
About This Home
This home is located at 863 Hudson Rd, Saint Paul, MN 55106 and is currently estimated at $258,463, approximately $113 per square foot. 863 Hudson Rd is a home located in Ramsey County with nearby schools including Dayton's Bluff Achievement Plus Elementary School, Battle Creek Middle School, and Harding Senior High School.
Ownership History
Date
Name
Owned For
Owner Type
Purchase Details
Closed on
Dec 13, 2020
Sold by
Blanda Patrick James
Bought by
Blanda Patrick James and Blanda Kristina
Current Estimated Value
Home Financials for this Owner
Home Financials are based on the most recent Mortgage that was taken out on this home.
Original Mortgage
$112,504
Outstanding Balance
$100,180
Interest Rate
2.71%
Mortgage Type
VA
Estimated Equity
$158,283
Purchase Details
Closed on
Sep 5, 1997
Sold by
Roth Myron A
Bought by
Weber Robert L and Weber Patricia A
Create a Home Valuation Report for This Property
The Home Valuation Report is an in-depth analysis detailing your home's value as well as a comparison with similar homes in the area
Home Values in the Area
Average Home Value in this Area
Purchase History
| Date | Buyer | Sale Price | Title Company |
|---|---|---|---|
| Blanda Patrick James | -- | Timios Inc | |
| Weber Robert L | $50,000 | -- |
Source: Public Records
Mortgage History
| Date | Status | Borrower | Loan Amount |
|---|---|---|---|
| Open | Blanda Patrick James | $112,504 | |
| Closed | Weber Robert L | -- |
Source: Public Records
Tax History Compared to Growth
Tax History
| Year | Tax Paid | Tax Assessment Tax Assessment Total Assessment is a certain percentage of the fair market value that is determined by local assessors to be the total taxable value of land and additions on the property. | Land | Improvement |
|---|---|---|---|---|
| 2025 | $4,632 | $227,200 | $19,600 | $207,600 |
| 2023 | $4,632 | $204,900 | $10,200 | $194,700 |
| 2022 | $3,978 | $186,700 | $10,200 | $176,500 |
| 2021 | $3,986 | $165,300 | $10,200 | $155,100 |
| 2020 | $3,818 | $176,700 | $10,200 | $166,500 |
| 2019 | $3,204 | $123,700 | $10,200 | $113,500 |
| 2018 | $3,892 | $115,000 | $10,200 | $104,800 |
| 2017 | $3,098 | $116,800 | $10,200 | $106,600 |
| 2016 | $2,968 | $0 | $0 | $0 |
| 2015 | $2,866 | $100,600 | $8,600 | $92,000 |
| 2014 | $2,642 | $0 | $0 | $0 |
Source: Public Records
Map
Nearby Homes