Estimated Value: $384,000 - $453,000
3
Beds
2
Baths
1,171
Sq Ft
$349/Sq Ft
Est. Value
About This Home
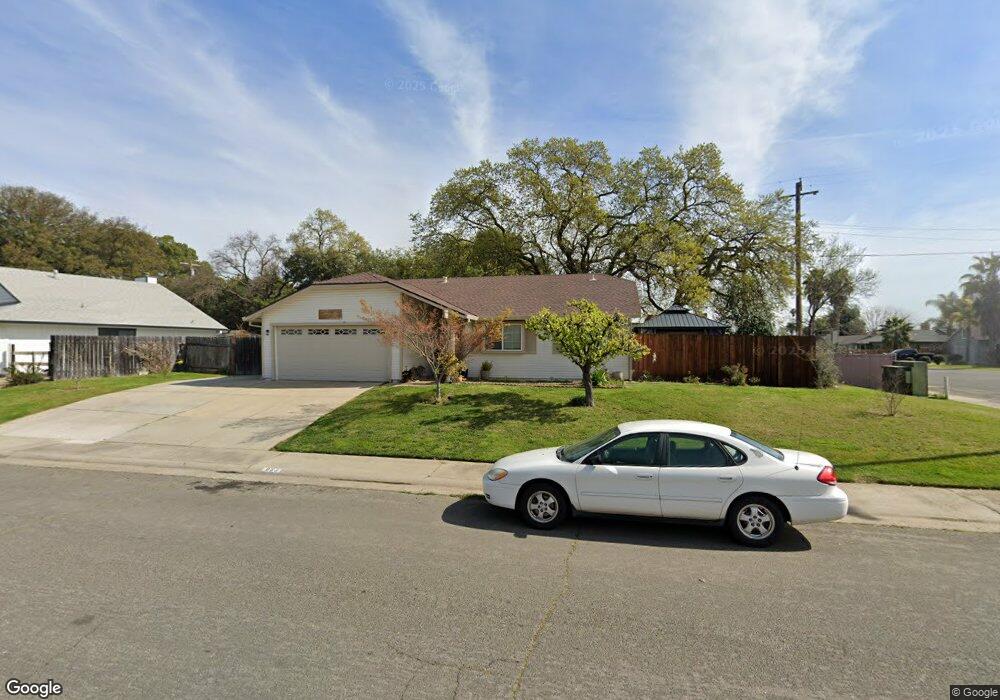
This home is located at 863 Stetson Way, Galt, CA 95632 and is currently estimated at $408,143, approximately $348 per square foot. 863 Stetson Way is a home located in Sacramento County with nearby schools including Valley Oaks Elementary School, Robert L. McCaffrey Middle School, and Galt High School.
Ownership History
Date
Name
Owned For
Owner Type
Purchase Details
Closed on
Dec 17, 1998
Sold by
Hud
Bought by
Delarosa Gerardo and Delarosa Victoria
Current Estimated Value
Home Financials for this Owner
Home Financials are based on the most recent Mortgage that was taken out on this home.
Original Mortgage
$118,000
Outstanding Balance
$27,105
Interest Rate
6.91%
Estimated Equity
$381,038
Purchase Details
Closed on
Apr 21, 1998
Sold by
Duenez Fernando L and Duenez Rosario M
Bought by
Countrywide Home Loans Inc
Purchase Details
Closed on
Sep 10, 1997
Sold by
Countrywide Home Loans Inc
Bought by
Hud
Create a Home Valuation Report for This Property
The Home Valuation Report is an in-depth analysis detailing your home's value as well as a comparison with similar homes in the area
Home Values in the Area
Average Home Value in this Area
Purchase History
| Date | Buyer | Sale Price | Title Company |
|---|---|---|---|
| Delarosa Gerardo | $100,000 | Stewart Title | |
| Countrywide Home Loans Inc | $79,614 | -- | |
| Hud | -- | -- |
Source: Public Records
Mortgage History
| Date | Status | Borrower | Loan Amount |
|---|---|---|---|
| Open | Delarosa Gerardo | $118,000 |
Source: Public Records
Tax History
| Year | Tax Paid | Tax Assessment Tax Assessment Total Assessment is a certain percentage of the fair market value that is determined by local assessors to be the total taxable value of land and additions on the property. | Land | Improvement |
|---|---|---|---|---|
| 2025 | $1,715 | $163,016 | $39,180 | $123,836 |
| 2024 | $1,715 | $159,820 | $38,412 | $121,408 |
| 2023 | $1,685 | $156,687 | $37,659 | $119,028 |
| 2022 | $1,616 | $153,616 | $36,921 | $116,695 |
| 2021 | $1,616 | $150,605 | $36,198 | $114,407 |
| 2020 | $1,602 | $149,061 | $35,827 | $113,234 |
| 2019 | $1,560 | $146,139 | $35,125 | $111,014 |
| 2018 | $1,557 | $143,275 | $34,437 | $108,838 |
| 2017 | $1,494 | $140,466 | $33,762 | $106,704 |
| 2016 | $1,434 | $137,712 | $33,100 | $104,612 |
| 2015 | $1,383 | $135,644 | $32,603 | $103,041 |
| 2014 | $1,378 | $132,988 | $31,965 | $101,023 |
Source: Public Records
Map
Nearby Homes
Your Personal Tour Guide
Ask me questions while you tour the home.