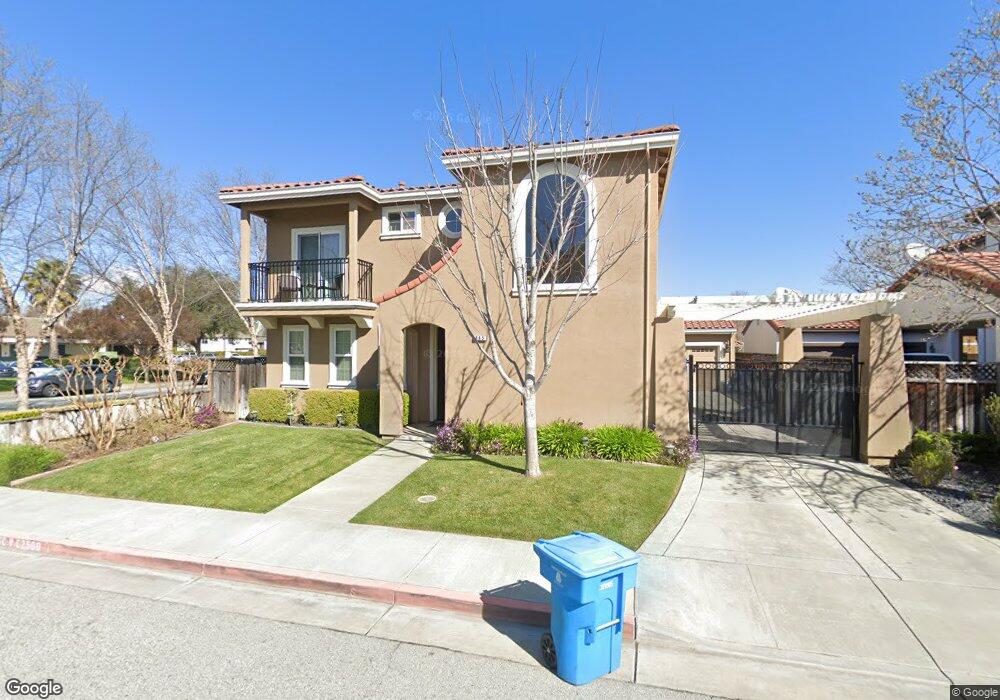
865 Cabrillo Ct Gilroy, CA 95020
Las Animas NeighborhoodEstimated Value: $1,009,000 - $1,142,000
3
Beds
3
Baths
2,679
Sq Ft
$404/Sq Ft
Est. Value
About This Home
This home is located at 865 Cabrillo Ct, Gilroy, CA 95020 and is currently estimated at $1,081,153, approximately $403 per square foot. 865 Cabrillo Ct is a home located in Santa Clara County with nearby schools including Rod Kelley Elementary School, South Valley Middle School, and Solorsano Middle School.
Ownership History
Date
Name
Owned For
Owner Type
Purchase Details
Closed on
Aug 7, 2020
Sold by
Leal Maria E and Leal Maria
Bought by
Leal Maria E
Current Estimated Value
Home Financials for this Owner
Home Financials are based on the most recent Mortgage that was taken out on this home.
Original Mortgage
$644,300
Outstanding Balance
$566,370
Interest Rate
3%
Mortgage Type
New Conventional
Estimated Equity
$514,783
Purchase Details
Closed on
Dec 22, 2008
Sold by
Goodgion Richard and Goodgion Mary
Bought by
Leal Maria
Home Financials for this Owner
Home Financials are based on the most recent Mortgage that was taken out on this home.
Original Mortgage
$30,000
Interest Rate
3%
Mortgage Type
Stand Alone Second
Purchase Details
Closed on
Nov 8, 2004
Sold by
Niles Development Llc
Bought by
Goodgion Richard and Goodgion Mary
Home Financials for this Owner
Home Financials are based on the most recent Mortgage that was taken out on this home.
Original Mortgage
$448,950
Interest Rate
5.5%
Mortgage Type
Purchase Money Mortgage
Purchase Details
Closed on
Feb 24, 2004
Sold by
Mussallem Neil L
Bought by
Niles Development Llc
Create a Home Valuation Report for This Property
The Home Valuation Report is an in-depth analysis detailing your home's value as well as a comparison with similar homes in the area
Home Values in the Area
Average Home Value in this Area
Purchase History
| Date | Buyer | Sale Price | Title Company |
|---|---|---|---|
| Leal Maria E | -- | None Listed On Document | |
| Leal Maria | $465,000 | Chicago Title Company | |
| Goodgion Richard | -- | Chicago Title | |
| Niles Development Llc | -- | Chicago Title |
Source: Public Records
Mortgage History
| Date | Status | Borrower | Loan Amount |
|---|---|---|---|
| Open | Leal Maria E | $644,300 | |
| Previous Owner | Leal Maria | $30,000 | |
| Previous Owner | Leal Maria | $442,612 | |
| Previous Owner | Goodgion Richard | $448,950 | |
| Closed | Goodgion Richard | $56,100 |
Source: Public Records
Tax History
| Year | Tax Paid | Tax Assessment Tax Assessment Total Assessment is a certain percentage of the fair market value that is determined by local assessors to be the total taxable value of land and additions on the property. | Land | Improvement |
|---|---|---|---|---|
| 2025 | $7,236 | $598,794 | $257,543 | $341,251 |
| 2024 | $7,236 | $587,054 | $252,494 | $334,560 |
| 2023 | $7,192 | $575,544 | $247,544 | $328,000 |
| 2022 | $7,072 | $564,260 | $242,691 | $321,569 |
| 2021 | $7,039 | $553,197 | $237,933 | $315,264 |
| 2020 | $6,961 | $547,526 | $235,494 | $312,032 |
| 2019 | $6,895 | $536,791 | $230,877 | $305,914 |
| 2018 | $6,437 | $526,266 | $226,350 | $299,916 |
| 2017 | $6,571 | $515,948 | $221,912 | $294,036 |
| 2016 | $6,437 | $505,832 | $217,561 | $288,271 |
| 2015 | $6,072 | $498,235 | $214,294 | $283,941 |
| 2014 | $6,033 | $488,476 | $210,097 | $278,379 |
Source: Public Records
Map
Nearby Homes
- 735 Painter Ct
- 1008 Primrose Ln
- 9190 Avezan Way
- 500 Ronan Ave
- 8170 Westwood Dr Unit 22
- 1206 Sycamore Ct
- 760 Welburn Ave
- 946 Martiri Ct
- 1392 Mantelli Dr
- 1320 Heritage Way
- 1165 Lerma Ln
- 401 Arnold Dr
- 1404 Casablanca Cir
- 1501 Welburn Ave
- 7969 Kipling Cir
- 1231 Juniper Dr Unit H
- 8120 Catalina Ct
- 9400 Benbow Dr
- 7942 English Oak Cir
- 1555 Hecker Pass Rd Unit H102
- 855 Cabrillo Ct
- 861 El Gato Way
- 8780 Kern Ave
- 845 Cabrillo Ct
- 851 El Gato Way
- 835 Cabrillo Ct
- 892 Camrose Ct
- 8760 Kern Ave
- 861 Lawrence Dr
- 851 Lawrence Dr
- 841 El Gato Way
- 882 Camrose Ct
- 872 Camrose Ct
- 825 Cabrillo Ct
- 8740 Kern Ave
- 831 El Gato Way
- 841 Lawrence Dr
- 860 Lawrence Dr
- 862 Camrose Ct
- 897 Camrose Ct
Your Personal Tour Guide
Ask me questions while you tour the home.