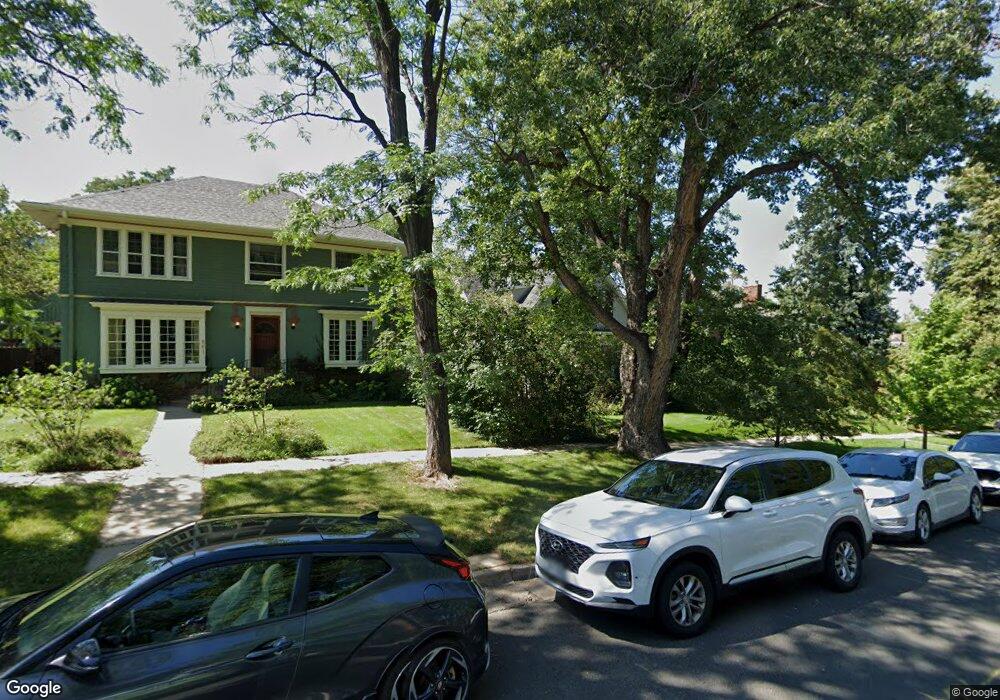
869 11th St Boulder, CO 80302
University Hill NeighborhoodEstimated Value: $1,429,811 - $1,798,000
3
Beds
2
Baths
1,848
Sq Ft
$890/Sq Ft
Est. Value
About This Home
This home is located at 869 11th St, Boulder, CO 80302 and is currently estimated at $1,643,953, approximately $889 per square foot. 869 11th St is a home located in Boulder County with nearby schools including Flatirons Elementary School, Manhattan Middle School of the Arts & Academics, and Boulder High School.
Ownership History
Date
Name
Owned For
Owner Type
Purchase Details
Closed on
Apr 13, 2012
Sold by
Palmer Michael
Bought by
Palmer Charmaine M F
Current Estimated Value
Purchase Details
Closed on
May 3, 1976
Bought by
Palmer Charmaine M F
Purchase Details
Closed on
Aug 18, 1975
Bought by
Palmer Charmaine M F
Create a Home Valuation Report for This Property
The Home Valuation Report is an in-depth analysis detailing your home's value as well as a comparison with similar homes in the area
Home Values in the Area
Average Home Value in this Area
Purchase History
| Date | Buyer | Sale Price | Title Company |
|---|---|---|---|
| Palmer Charmaine M F | -- | None Available | |
| Palmer Charmaine M F | $60,000 | -- | |
| Palmer Charmaine M F | $53,200 | -- |
Source: Public Records
Tax History Compared to Growth
Tax History
| Year | Tax Paid | Tax Assessment Tax Assessment Total Assessment is a certain percentage of the fair market value that is determined by local assessors to be the total taxable value of land and additions on the property. | Land | Improvement |
|---|---|---|---|---|
| 2025 | $7,149 | $85,081 | $56,075 | $29,006 |
| 2024 | $7,149 | $85,081 | $56,075 | $29,006 |
| 2023 | $7,025 | $88,051 | $57,138 | $34,599 |
| 2022 | $6,275 | $74,518 | $46,815 | $27,703 |
| 2021 | $5,983 | $76,662 | $48,162 | $28,500 |
| 2020 | $5,605 | $71,543 | $40,112 | $31,431 |
| 2019 | $5,519 | $71,543 | $40,112 | $31,431 |
| 2018 | $4,970 | $64,526 | $35,928 | $28,598 |
| 2017 | $4,815 | $71,337 | $39,720 | $31,617 |
| 2016 | $4,505 | $60,003 | $32,875 | $27,128 |
| 2015 | $4,266 | $53,452 | $26,348 | $27,104 |
| 2014 | $3,825 | $53,452 | $26,348 | $27,104 |
Source: Public Records
Map
Nearby Homes
- 911 Lincoln Place
- 757 12th St
- 845 14th St
- 800 Grant Place
- 1037 12th St
- 1010 9th St
- 650 12th St
- 764 14th St
- 1200 College Ave Unit 123
- 961 16th St Unit 2
- 961 16th St Unit 5
- 1085 Broadway St Unit 4
- 772 16th St
- 820 6th St
- 333 Bellevue Dr
- 972 Pleasant St
- 1006 6th St
- 1380 Bluebell Ave
- 440 Christmas Tree Dr
- 350 15th St