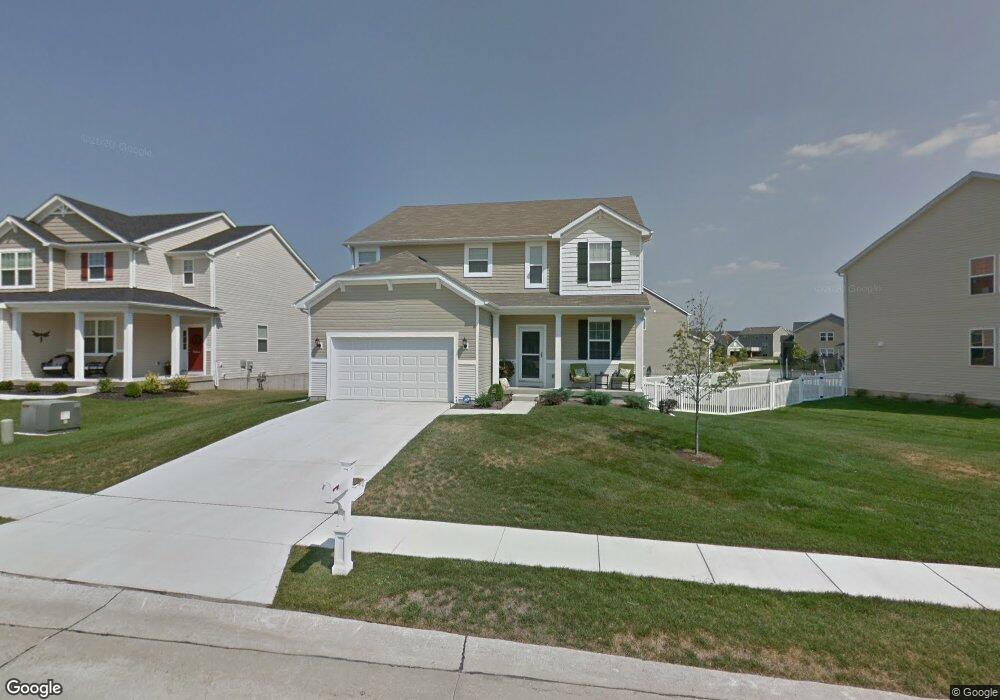
869 Ashton Way Cir Eureka, MO 63025
Estimated Value: $486,000 - $542,000
5
Beds
5
Baths
3,051
Sq Ft
$170/Sq Ft
Est. Value
About This Home
This home is located at 869 Ashton Way Cir, Eureka, MO 63025 and is currently estimated at $518,702, approximately $170 per square foot. 869 Ashton Way Cir is a home with nearby schools including Eureka Elementary School, Lasalle Springs Middle School, and Eureka Senior High School.
Ownership History
Date
Name
Owned For
Owner Type
Purchase Details
Closed on
Jul 1, 2024
Sold by
Pogue Jeanne Marie
Bought by
Pogue Jeanne Marie and Pogue James David
Current Estimated Value
Home Financials for this Owner
Home Financials are based on the most recent Mortgage that was taken out on this home.
Original Mortgage
$120,000
Outstanding Balance
$118,553
Interest Rate
6.94%
Mortgage Type
New Conventional
Estimated Equity
$400,149
Purchase Details
Closed on
Dec 20, 2018
Sold by
Pogue James and Pogue Jeanne
Bought by
Pogue Jeanne
Home Financials for this Owner
Home Financials are based on the most recent Mortgage that was taken out on this home.
Original Mortgage
$230,000
Interest Rate
4.8%
Mortgage Type
New Conventional
Purchase Details
Closed on
Oct 15, 2012
Sold by
The Jones Company Homes Llc
Bought by
Pogue James and Pogue Jeanne
Home Financials for this Owner
Home Financials are based on the most recent Mortgage that was taken out on this home.
Original Mortgage
$275,255
Interest Rate
3.61%
Mortgage Type
New Conventional
Create a Home Valuation Report for This Property
The Home Valuation Report is an in-depth analysis detailing your home's value as well as a comparison with similar homes in the area
Home Values in the Area
Average Home Value in this Area
Purchase History
| Date | Buyer | Sale Price | Title Company |
|---|---|---|---|
| Pogue Jeanne Marie | -- | Servicelink | |
| Pogue Jeanne | -- | Integrity Title Sln Llc | |
| Pogue James | $283,769 | Pgp Title |
Source: Public Records
Mortgage History
| Date | Status | Borrower | Loan Amount |
|---|---|---|---|
| Open | Pogue Jeanne Marie | $120,000 | |
| Previous Owner | Pogue Jeanne | $230,000 | |
| Previous Owner | Pogue James | $275,255 |
Source: Public Records
Tax History
| Year | Tax Paid | Tax Assessment Tax Assessment Total Assessment is a certain percentage of the fair market value that is determined by local assessors to be the total taxable value of land and additions on the property. | Land | Improvement |
|---|---|---|---|---|
| 2025 | $5,851 | $87,180 | $20,010 | $67,170 |
| 2024 | $5,851 | $78,370 | $8,340 | $70,030 |
| 2023 | $5,856 | $78,370 | $8,340 | $70,030 |
| 2022 | $5,556 | $69,180 | $8,340 | $60,840 |
| 2021 | $5,515 | $69,180 | $8,340 | $60,840 |
| 2020 | $5,372 | $64,430 | $13,340 | $51,090 |
| 2019 | $5,388 | $64,430 | $13,340 | $51,090 |
| 2018 | $5,237 | $59,080 | $11,670 | $47,410 |
| 2016 | $4,466 | $50,300 | $11,670 | $38,630 |
Source: Public Records
Map
Nearby Homes
- 715 Ashton Way Cir
- 5357 Lakepath Way
- 5395 Trailhead Ct
- 5341 Lakepath Way
- 756 Brewster Rd
- 5309 Trailhead Ct
- 679 Grand View Ridge Ct
- 994 Stone Spring Dr
- 674 Grandview Ridge Ct
- 5380 Shawnee View Ct
- 5315 Shawnee View Ct
- 132 Hunters Green Ln
- 111 O Sullivan Ave
- 5616 Hunters Ford Rd
- 160 Hunters Run Ct
- 761 Southern Hills Dr
- 3 Leona Ln
- 679 Bluffs View Ct
- 412 Parkview Ln
- 1200 Hunters Chase Dr
- 873 Ashton Way Cir
- 865 Ashton Way Cir
- 1657 Grace View Dr
- 877 Ashton Way Cir
- 1653 Grace View Dr
- 868 Ashton Way Cir
- 876 Ashton Way Cir
- 864 Ashton Way Cir
- 1658 Grace View Dr
- 853 Ashton Way Cir
- 872 Ashton Way Cir
- 1649 Grace View Dr
- 860 Ashton Way Cir
- 1646 Grace View Dr
- 849 Ashton Way Cir
- 856 Ashton Way Cir
- 1645 Grace View Dr
- 845 Ashton Way Cir
- 1638 Grace View Dr
- 1624 Wellington Woods Dr
Your Personal Tour Guide
Ask me questions while you tour the home.