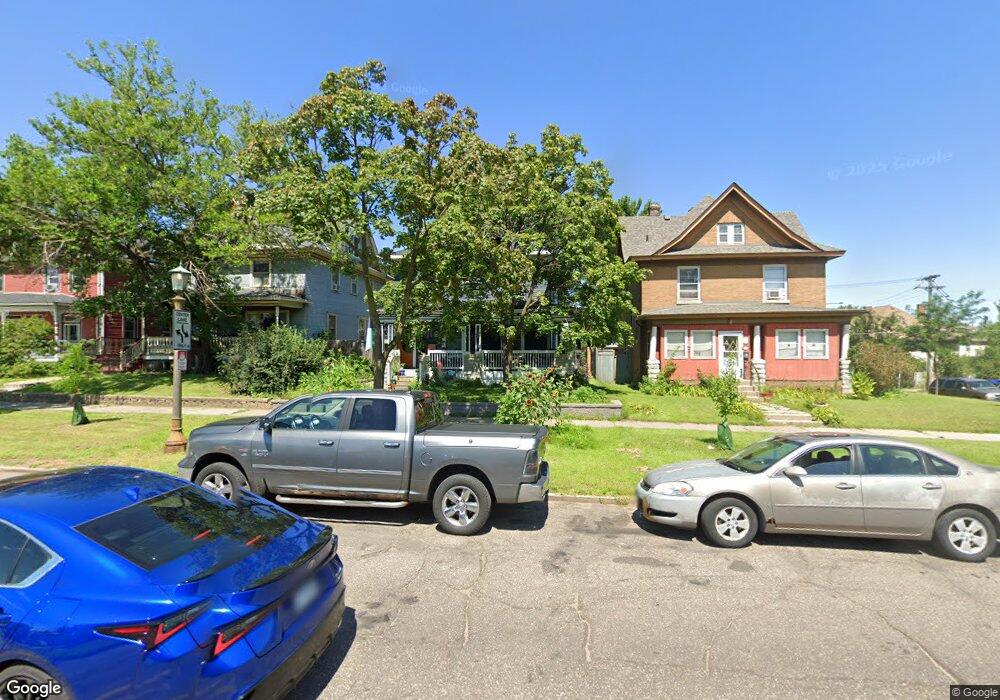
869 Marshall Ave Saint Paul, MN 55104
Summit-University NeighborhoodEstimated Value: $464,000 - $546,000
4
Beds
2
Baths
1,449
Sq Ft
$342/Sq Ft
Est. Value
About This Home
This home is located at 869 Marshall Ave, Saint Paul, MN 55104 and is currently estimated at $495,350, approximately $341 per square foot. 869 Marshall Ave is a home located in Ramsey County with nearby schools including Maxfield Magnet Elementary School, Hidden River Middle School, and Central Senior High School.
Ownership History
Date
Name
Owned For
Owner Type
Purchase Details
Closed on
Nov 13, 2015
Sold by
S & D Real Estate Solutions Llc
Bought by
Hoberg Clint R and Connell Jodi L
Current Estimated Value
Home Financials for this Owner
Home Financials are based on the most recent Mortgage that was taken out on this home.
Original Mortgage
$265,050
Interest Rate
3.74%
Mortgage Type
New Conventional
Purchase Details
Closed on
Nov 12, 2014
Sold by
Tbs Holdings Llc
Bought by
S & D Real Estate Solutions Llc
Home Financials for this Owner
Home Financials are based on the most recent Mortgage that was taken out on this home.
Original Mortgage
$162,240
Interest Rate
3.97%
Mortgage Type
Construction
Purchase Details
Closed on
Nov 4, 2010
Sold by
Vevea Lyle W
Bought by
Tbs Holdings Llc
Create a Home Valuation Report for This Property
The Home Valuation Report is an in-depth analysis detailing your home's value as well as a comparison with similar homes in the area
Home Values in the Area
Average Home Value in this Area
Purchase History
| Date | Buyer | Sale Price | Title Company |
|---|---|---|---|
| Hoberg Clint R | $279,000 | Liberty Title Inc | |
| S & D Real Estate Solutions Llc | $143,212 | Land Title Inc | |
| -- | $139,000 | -- | |
| Tbs Holdings Llc | $515 | None Available |
Source: Public Records
Mortgage History
| Date | Status | Borrower | Loan Amount |
|---|---|---|---|
| Open | Hoberg Clint R | $232,500 | |
| Closed | Hoberg Clint R | $265,050 | |
| Previous Owner | S&D Real Estate Solutions Llc | $162,240 |
Source: Public Records
Tax History Compared to Growth
Tax History
| Year | Tax Paid | Tax Assessment Tax Assessment Total Assessment is a certain percentage of the fair market value that is determined by local assessors to be the total taxable value of land and additions on the property. | Land | Improvement |
|---|---|---|---|---|
| 2025 | $7,078 | $499,900 | $48,000 | $451,900 |
| 2023 | $7,078 | $459,000 | $48,000 | $411,000 |
| 2022 | $6,112 | $460,500 | $48,000 | $412,500 |
| 2021 | $5,840 | $379,800 | $48,000 | $331,800 |
| 2020 | $6,058 | $376,600 | $48,000 | $328,600 |
| 2019 | $5,832 | $364,000 | $48,000 | $316,000 |
| 2018 | $5,076 | $347,300 | $48,000 | $299,300 |
| 2017 | $4,220 | $314,000 | $48,000 | $266,000 |
| 2016 | $1,972 | $0 | $0 | $0 |
| 2015 | $1,243 | $139,100 | $38,400 | $100,700 |
| 2014 | $1,940 | $0 | $0 | $0 |
Source: Public Records
Map
Nearby Homes
- 912 Iglehart Ave
- 896 Carroll Ave
- 291 Fisk St
- 786 Iglehart Ave
- 287 Avon St N
- 298 Avon St N
- 984 Iglehart Ave
- 987 Dayton Ave
- 998 Dayton Ave Unit 2
- 1008 Carroll Ave
- 927 Central Ave W
- 864 Fuller Ave
- 811 Ashland Ave
- 1034 Carroll Ave
- 757 Laurel Ave
- 957 Ashland Ave
- 1048 Marshall Ave
- 905 Fuller Ave
- 742 Laurel Ave
- 681 Dayton Ave
- 873 Marshall Ave
- 863 Marshall Ave
- 877 and 875 Marshall Avenue Ave
- 877 and 875 Marshall Ave
- 877 Marshall Ave
- 868 Iglehart Ave
- 883 Marshall Ave
- 872 Iglehart Ave
- 862 Iglehart Ave
- 876 Iglehart Ave
- 857 Marshall Ave
- 880 Iglehart Ave
- 887 Marshall Ave
- 884 Iglehart Ave
- 856 Iglehart Ave
- 853 Marshall Ave
- 888 Iglehart Ave
- 854 Iglehart Ave
- 238 Victoria St N
- 890 Iglehart Ave