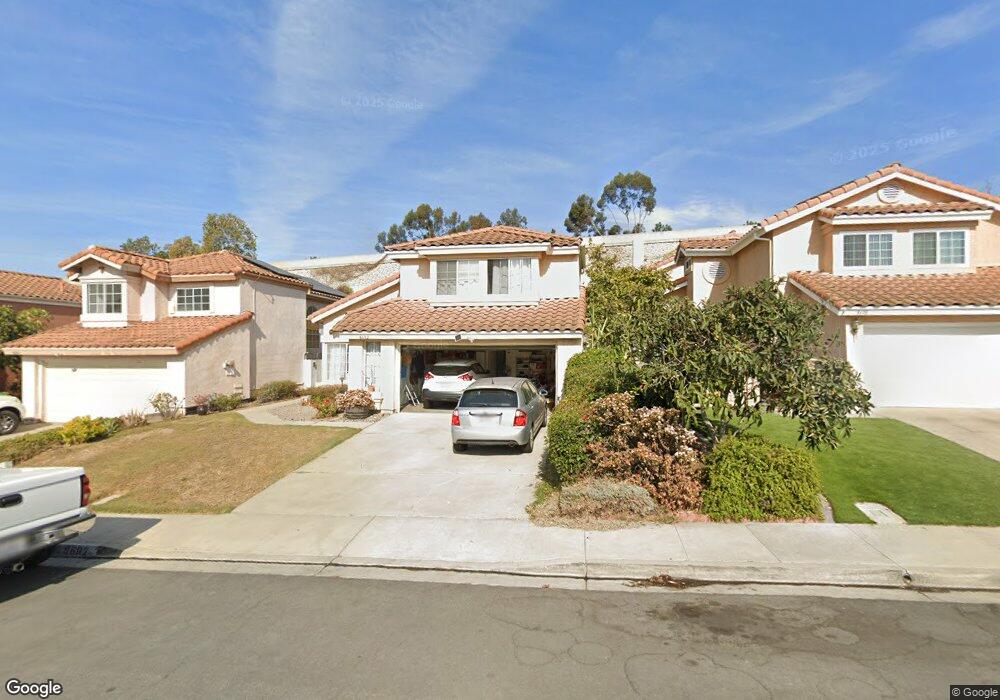
8692 Park Run Rd San Diego, CA 92129
Rancho Peñasquitos NeighborhoodEstimated Value: $1,244,000 - $1,496,000
4
Beds
3
Baths
1,988
Sq Ft
$688/Sq Ft
Est. Value
About This Home
This home is located at 8692 Park Run Rd, San Diego, CA 92129 and is currently estimated at $1,368,415, approximately $688 per square foot. 8692 Park Run Rd is a home located in San Diego County with nearby schools including Park Village Elementary School, Mesa Verde Middle School, and Westview High School.
Ownership History
Date
Name
Owned For
Owner Type
Purchase Details
Closed on
Jan 26, 2015
Sold by
Davis Miriam and Edusada Miriam D
Bought by
Davis Miriam
Current Estimated Value
Home Financials for this Owner
Home Financials are based on the most recent Mortgage that was taken out on this home.
Original Mortgage
$324,000
Outstanding Balance
$221,914
Interest Rate
3.76%
Mortgage Type
New Conventional
Estimated Equity
$1,146,501
Purchase Details
Closed on
Jul 3, 2013
Sold by
Edusada Edgar C
Bought by
Edusada Miriam D
Purchase Details
Closed on
Jun 17, 1996
Sold by
Kwok Yeung Min and Lang Cindy
Bought by
Edusada Edgar C and Edusada Miriam D
Home Financials for this Owner
Home Financials are based on the most recent Mortgage that was taken out on this home.
Original Mortgage
$171,000
Interest Rate
8.03%
Purchase Details
Closed on
Dec 9, 1987
Purchase Details
Closed on
Jun 13, 1986
Create a Home Valuation Report for This Property
The Home Valuation Report is an in-depth analysis detailing your home's value as well as a comparison with similar homes in the area
Home Values in the Area
Average Home Value in this Area
Purchase History
| Date | Buyer | Sale Price | Title Company |
|---|---|---|---|
| Davis Miriam | -- | Chicago Title Company | |
| Edusada Miriam D | -- | None Available | |
| Edusada Edgar C | $180,000 | Continental Lawyers Title Co | |
| -- | $166,000 | -- | |
| -- | $132,000 | -- |
Source: Public Records
Mortgage History
| Date | Status | Borrower | Loan Amount |
|---|---|---|---|
| Open | Davis Miriam | $324,000 | |
| Closed | Edusada Edgar C | $171,000 |
Source: Public Records
Tax History Compared to Growth
Tax History
| Year | Tax Paid | Tax Assessment Tax Assessment Total Assessment is a certain percentage of the fair market value that is determined by local assessors to be the total taxable value of land and additions on the property. | Land | Improvement |
|---|---|---|---|---|
| 2025 | $3,255 | $293,135 | $72,232 | $220,903 |
| 2024 | $3,255 | $287,388 | $70,816 | $216,572 |
| 2023 | $3,185 | $281,754 | $69,428 | $212,326 |
| 2022 | $3,129 | $276,230 | $68,067 | $208,163 |
| 2021 | $3,087 | $270,815 | $66,733 | $204,082 |
| 2020 | $3,044 | $268,039 | $66,049 | $201,990 |
| 2019 | $2,965 | $262,784 | $64,754 | $198,030 |
| 2018 | $2,886 | $257,633 | $63,485 | $194,148 |
| 2017 | $83 | $252,583 | $62,241 | $190,342 |
| 2016 | $2,732 | $247,631 | $61,021 | $186,610 |
| 2015 | $2,754 | $243,912 | $60,105 | $183,807 |
| 2014 | $2,691 | $239,135 | $58,928 | $180,207 |
Source: Public Records
Map
Nearby Homes
- 8754 Park Run Rd
- 8672 Creekwood Ln
- 12880 War Horse St
- 8695 Rideabout Ln
- 12573 Brickellia St
- 12537 Ginger Snap Ct
- 12740 Prairie Dog Ave
- 13146 Thunderhead St
- 12518 Darkwood Rd
- 12776 Isocoma St Unit 4
- 9012 Buckwheat St
- 9068 Buckwheat St
- 12465 Pathos Ln
- 9342 Twin Trails Dr Unit 303
- 9302 Twin Trails Dr Unit 204
- 12485 Picrus St
- 9446 Pipilo St
- 9458 Twin Trails Dr Unit 205
- 12660 Stella Ln
- 9525 Vervain St
- 8696 Park Run Rd
- 8686 Park Run Rd
- 8698 Park Run Rd Unit 4
- 8706 Park Run Rd
- 8678 Park Run Rd
- 8714 Park Run Rd
- 8672 Park Run Rd
- 8699 Park Run Rd Unit 4
- 8707 Park Run Rd
- 8722 Park Run Rd
- 8715 Park Run Rd
- 8664 Park Run Rd
- 8683 Park Run Rd
- 8723 Park Run Rd
- 8730 Park Run Rd
- 8658 Park Run Rd
- 8675 Park Run Rd
- 8731 Park Run Rd
- 8667 Park Run Rd
- 8739 Park Run Rd